A comparison tool is available to compare and communicate scenario strategies. Tools within the comparison include analytics and visualizations such as charts and maps. Up to four scenarios can be included in a single comparison. The limit is in place so that information is displayed appropriately.
Create a Comparison
To create a comparison between two scenarios using the same Roads profile but with different funding envelopes:
- Navigate to Decision Support 🢡 Comparison on the Home
- Click +New Comparison in the top right corner.
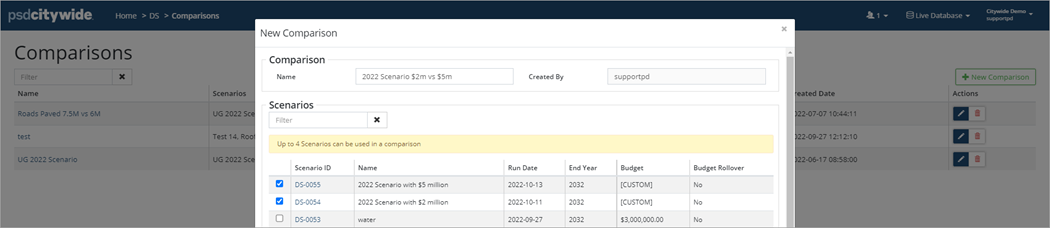
- Enter a Name and check ✅ the scenarios to include in the comparison. Up to 4 Scenarios can be used in a comparison.
- Click Add. The Comparison screen lists all comparisons and shows which scenarios are being compared, as well as the number of assets impacted and the date the comparison was created.
- Click to view a comparison.
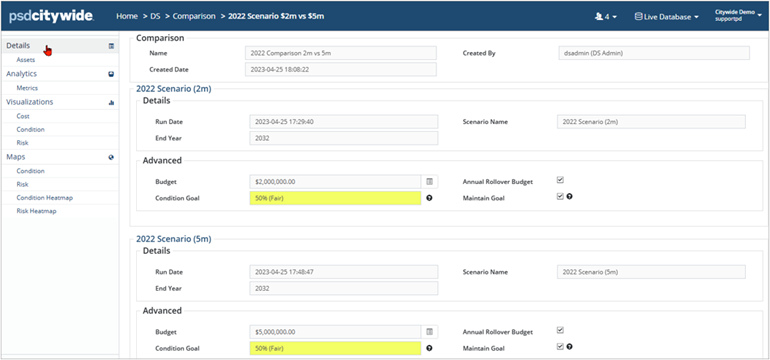
Details
The Details screen summarizes each scenario and is read-only.
The Assets screen lists the assets assigned to each scenario and shows Profile, In-Service Date, EUL, Replacement Cost, etc. Use the search field to filter the list or click an Asset ID to drill down into the asset.
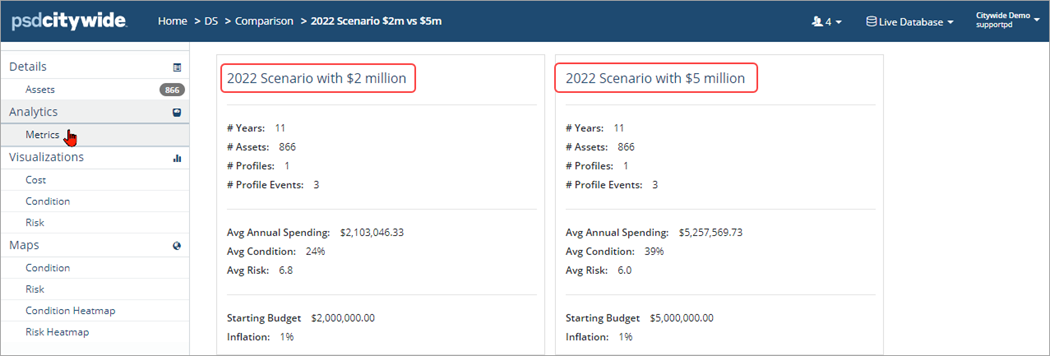
Analytics
The Analytics (Metrics) screen summarizes the impact that each scenario will have and includes the Average Annual Spending, as well as the Average Condition/Risk of each strategy.
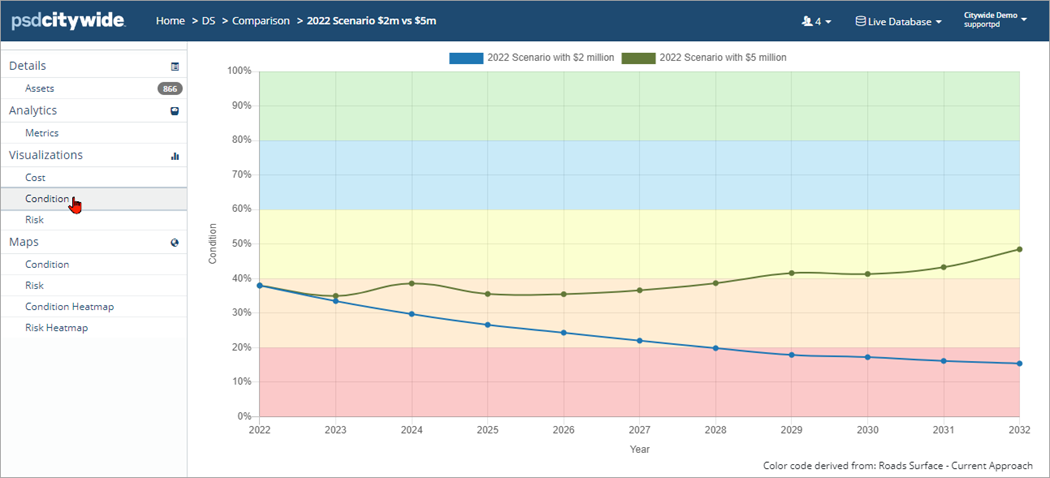
Visualizations
The Visualizations section provides data charts comparing Cost, Condition, and Risk showing trendlines for each. Charts can be saved or copied for use in other documents.
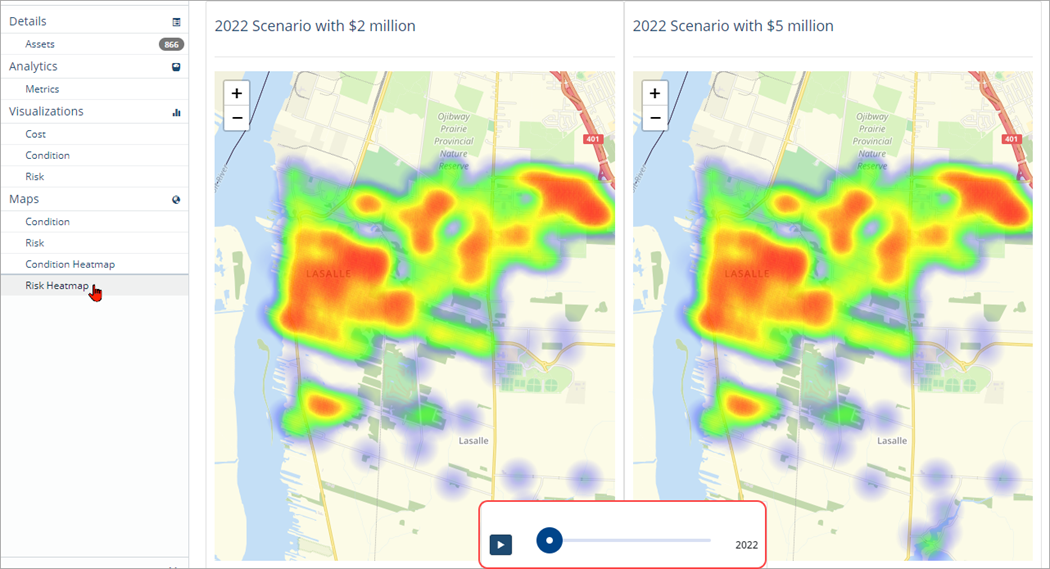
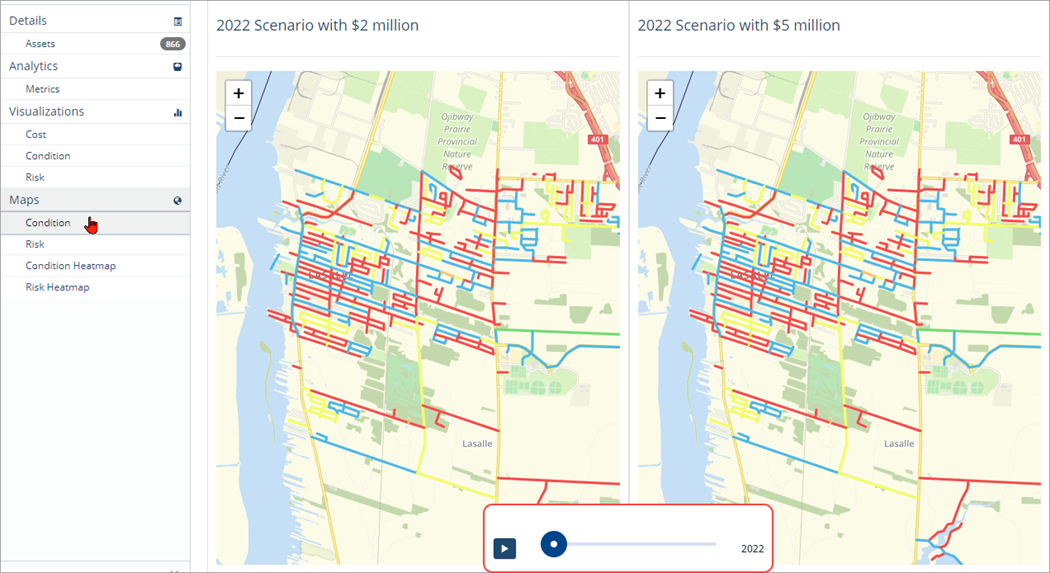
Maps
The Mapping tool requires an integration between Citywide Assets and GIS. If an integration does exist then the Maps section provides a visualization of the assets and their condition or risk in real time. A video time lapse shows how the assets change over the course of several years.
Risk Heatmap