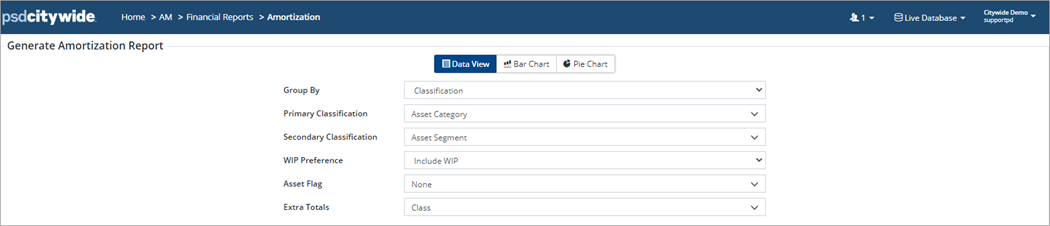
The Amortization Report reports on the amortization schedule showing the depreciation of each asset for the selected reporting year. You can generate three types of reports: Data View, Bar Chart, or Pie Chart. The following table summarizes each type.
|
Report Type |
|
|
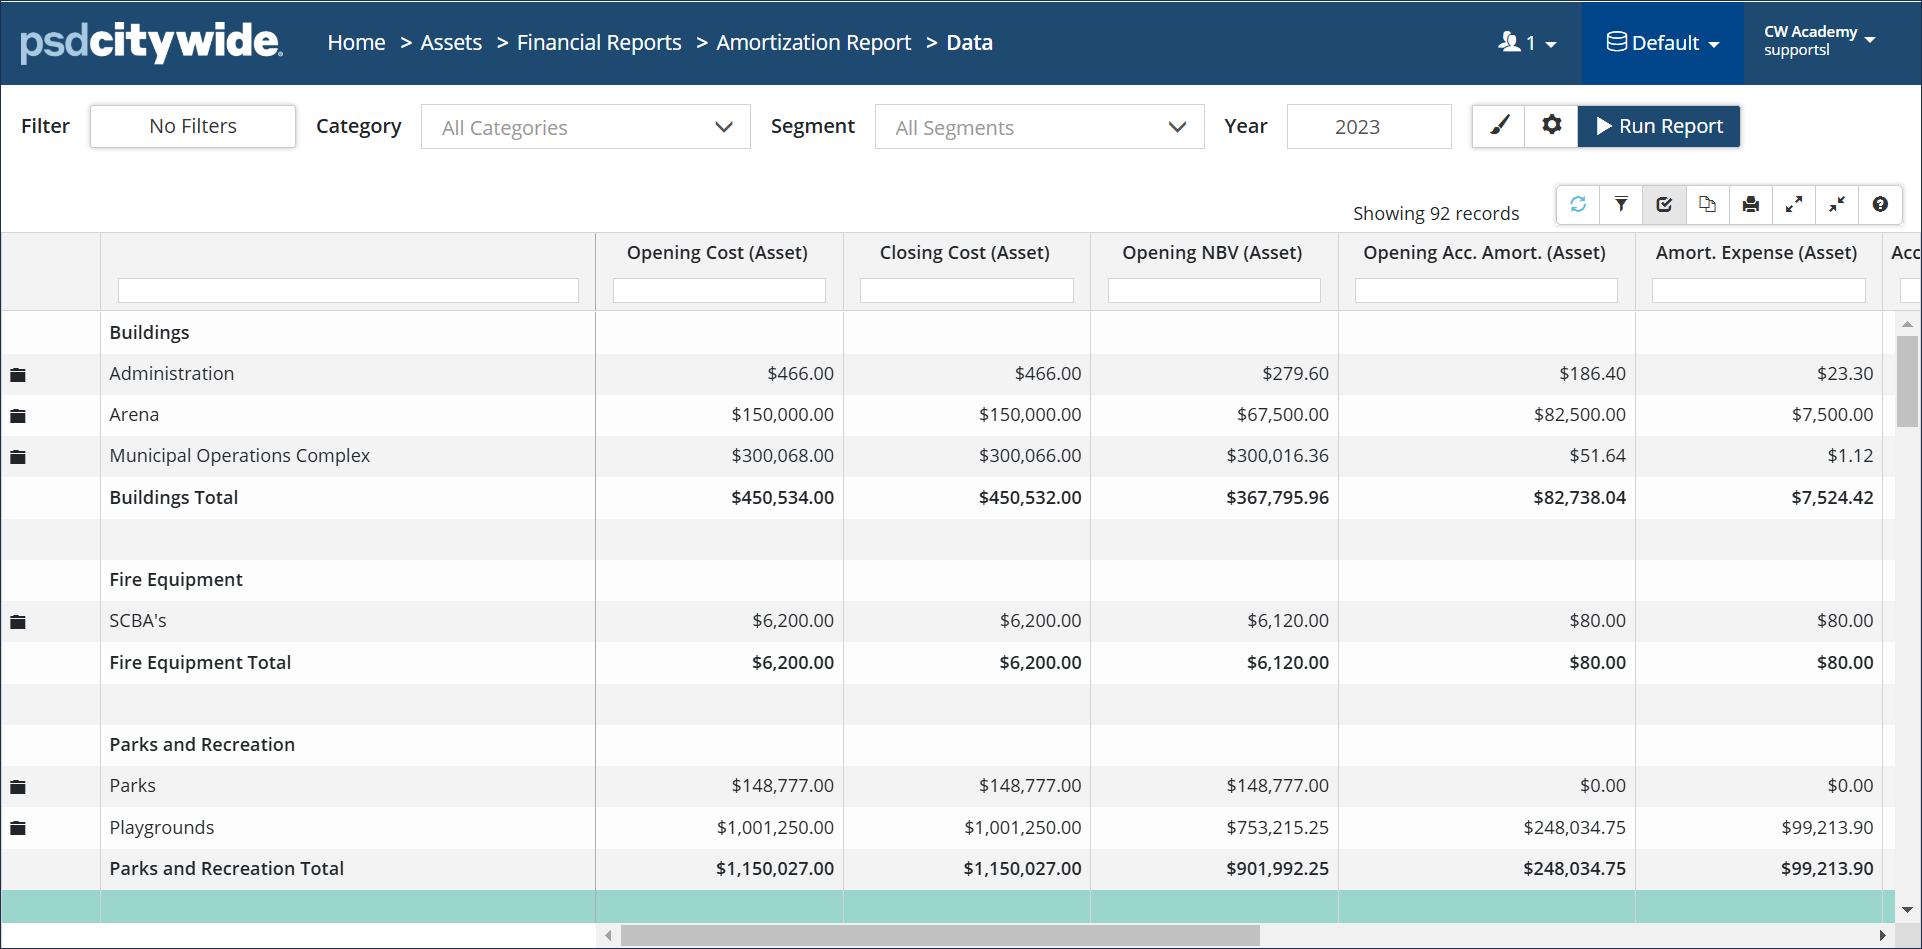
Data View: Classic expandable report view with aggregated data and a cumulative total. Click the folder to the left of a segment to view asset level detail. Click each folder or the Expand/Collapse icons in the grid options to expand and/or collapse all folders. In the Generate Amortization Report screen, set the Extra Totals field as Class to include totals for Infrastructure and General Capital at the bottom of the report. |
 |
|
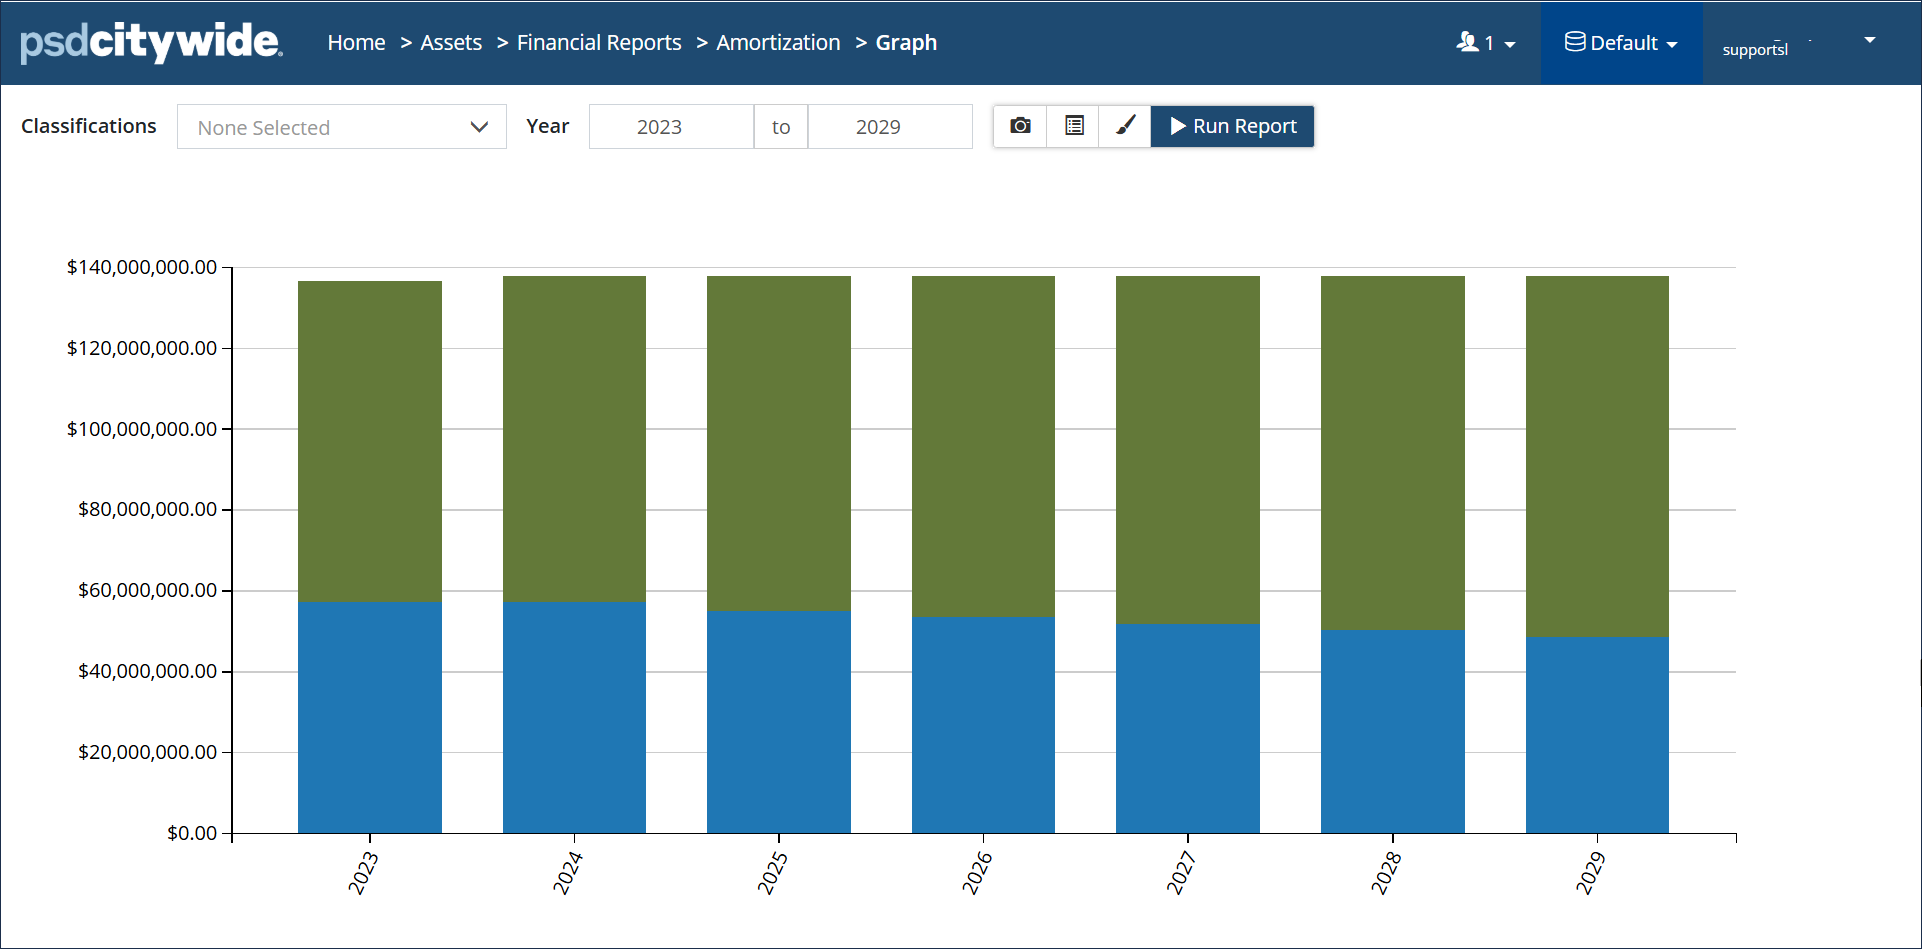
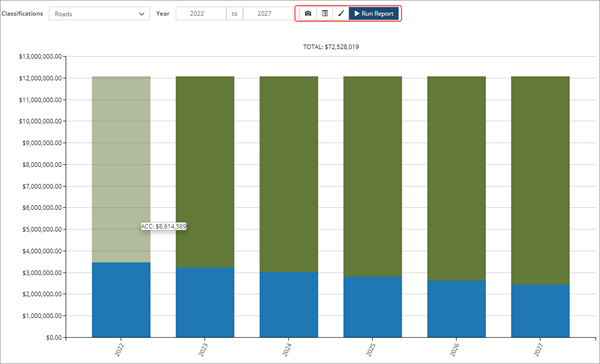
Bar Chart: Visualization of amortization information in a stacked column chart. The closing accumulated amortization (green) and the closing net book value (blue) display across a defined range of years. Hover over an individual column to display a screen tip with a $ amount. |
 |
|
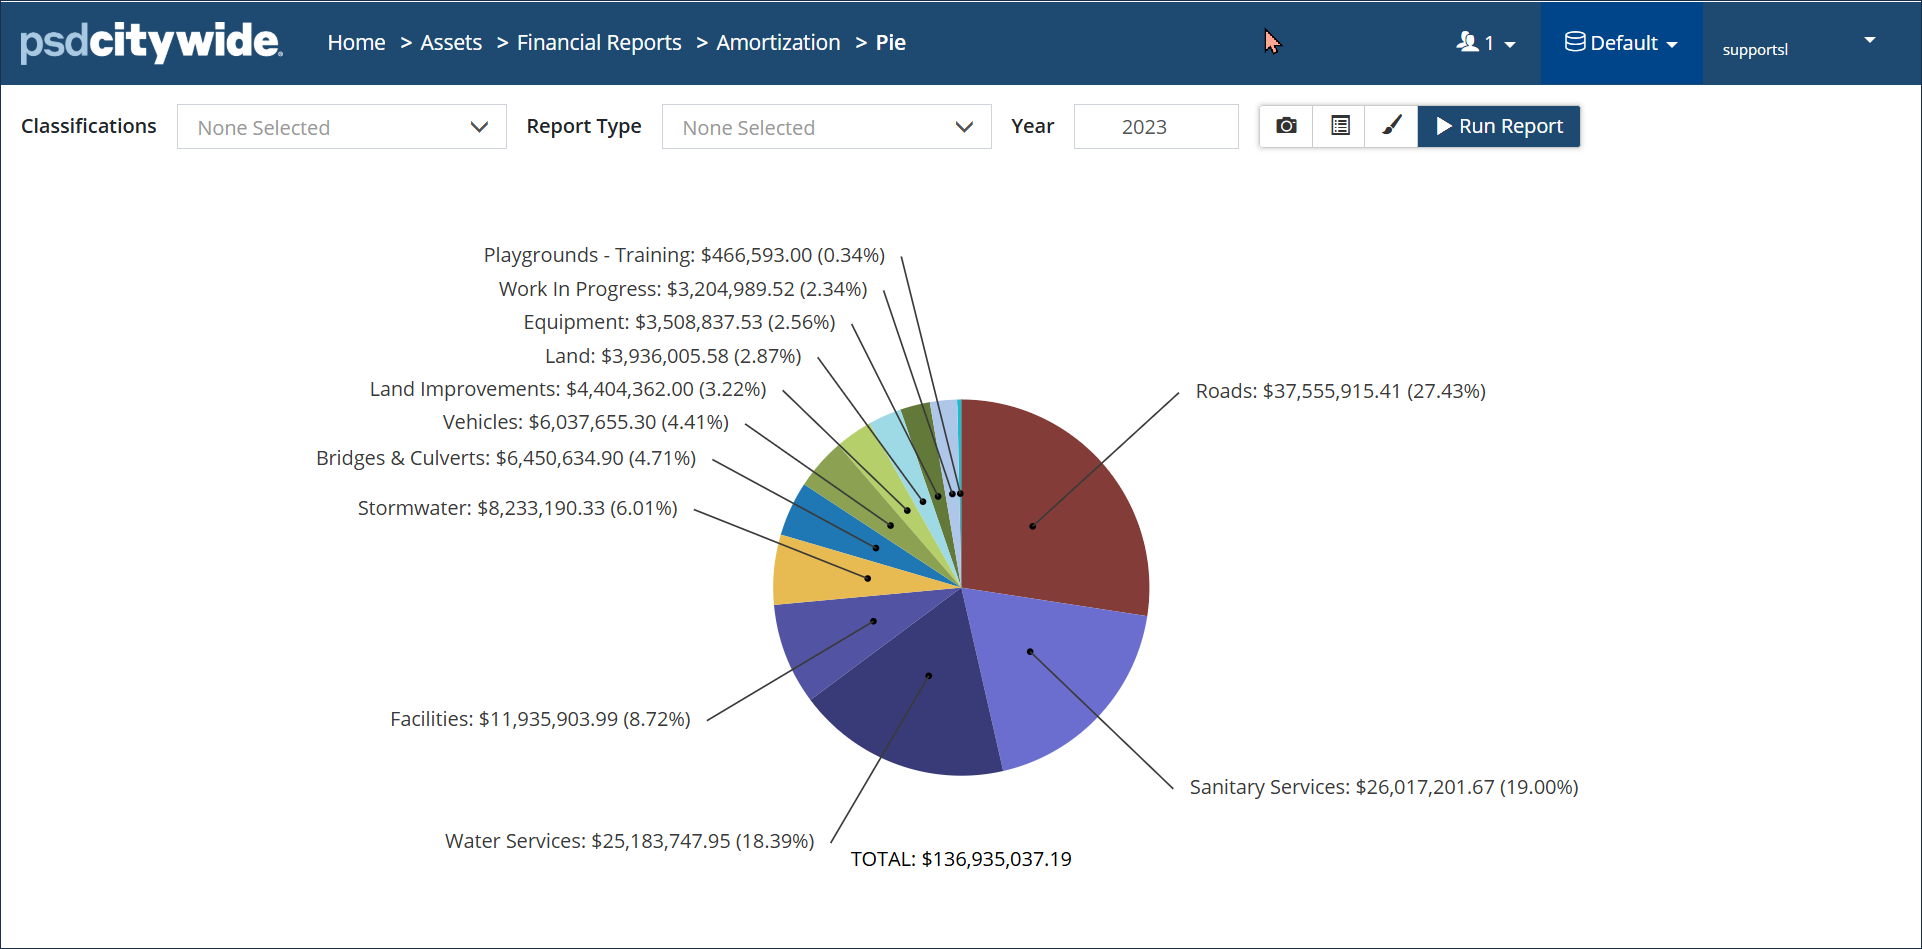
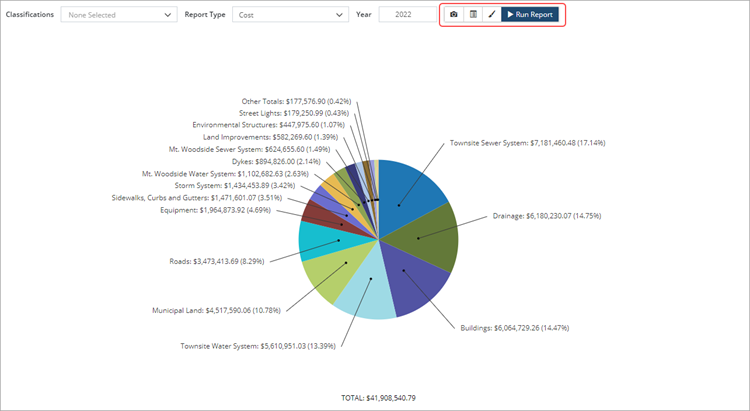
Pie Chart: Visualization of cost and amortization information in proportion to the whole. Pie charts within the Amortization report show Accumulated Amortization, Cost, Amortization Expense, or Net Book Value for groups of assets in relation to the total amount. |
 |
Run an Amortization Report
Step 1
Step 2
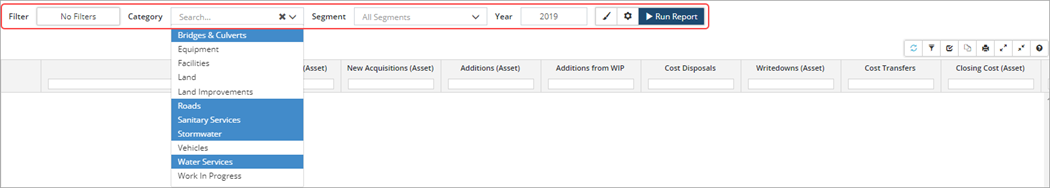
Click No Filters to narrow the scope of the assets collected in the report to a specific Classification or Coordinated ID. For example, you may want a report where the data is grouped by Category and Segment but only includes assets tagged with a specific Capital Code or Coordinated ID. Skip this step if no filters are needed.
Hold the Ctrl key on your keyboard to multi-select in the dropdown lists. This is used to select multiple Categories/Segments to include in the report.
Click Modify Report ![]() to change the display view:
to change the display view:
- Cost and Amortization is the default view
- Cost or Amortization Only can be selected to exclude data
- ARO Cost & Amortization – will report only on assets where an ARO has been identified
- Asset & ARO Combined Amortization – Assets where an ARO has been identified, will have Historical Cost and Initial ARO cost combined. (Note: For any ARO views, assets with an ARO disposal will also be included in the report.)
Once the report is generated, you can filter or view additional data using column headers or rearrange the columns as needed by dragging them to a new location. Click the Customize Columns button ![]() on the toolbar to select and save a modified view as a column set.
on the toolbar to select and save a modified view as a column set.
Click the folder icon ![]() to the left of a segment to expand it. The Asset ID and Name are linked, allowing you to view the asset details.
to the left of a segment to expand it. The Asset ID and Name are linked, allowing you to view the asset details.
Charts (Amortization Report)
Amortization data can be presented visually using the Bar or Pie Chart option.
Chart 1: Closing Accumulated Amortization and Closing NBV
Pie charts can visualize Accumulated Amortization, Amortization Expense, Cost, or NBV data.
Chart 2: Closing Cost by Category
 Additional Chart Options
Click Export Chart ![]() to save the chart as a .png or .jpg file. The file will save in your Downloads folder.
to save the chart as a .png or .jpg file. The file will save in your Downloads folder.
Click Show in Inventory ![]() to navigate to the Inventory List filtered to show only the assets that are being reported on.
to navigate to the Inventory List filtered to show only the assets that are being reported on.
Click Display Options ![]() to access the following:
to access the following:
- Show Total: Displays a cumulative total above the chart
- Font Size: Default is 12 pts but this can be changed temporarily here, or permanently in Preferences (Home 🡆 Administration 🡆 Preferences)
- Sort: sort the X-axis or Y-axis in ascending or descending order
- # of Decimal Places: Sets the decimal places for all chart labels and the total
- Hide Empty Values: When checked, removes data points with $0 (Pie charts)
Saved Reports (Amortization Report)
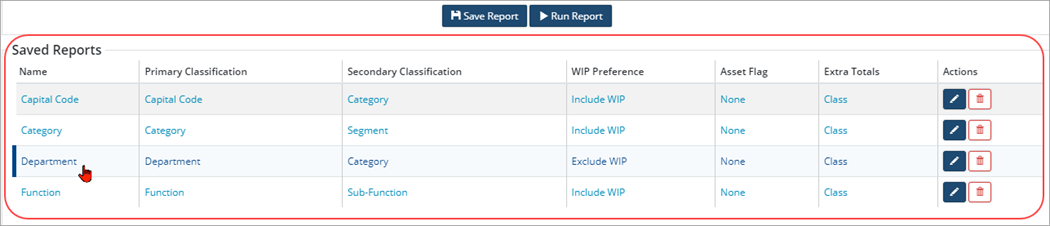
Report parameters can be saved as a custom report and quickly accessed under Saved Reports. The Amortization report has four saved reports but more can be created.
|
Saved Report |
Description |
|
Capital Code |
Data is grouped by Capital Code/Category, includes WIP assets and extra totals by Class. |
|
Category |
Data is grouped by Category/Segment, includes WIP assets and extra totals by Class. |
|
Department |
Data is grouped by Department/Category, excludes WIP assets and includes extra totals by Class. |
|
Function |
Data is grouped by Function/Sub-Function, includes WIP assets and extra totals by Class. |