Reports on the Risk rating of assets. By default, Citywide uses the industry standard Probability of failure multiplied by the Consequence of failure to determine a risk rating of 1 – 25. The specific metrics used to calculate Probability of failure and Consequence of failure are set at the Profile level.
The Risk calculation settings can be changed to use addition (Probability + Consequence instead of Probability * Consequence) for all profiles in the Manage Risk settings (Home 🡆 Asset Manager 🡆 Asset Profiles, and click ).
|
Report Type |
|
|
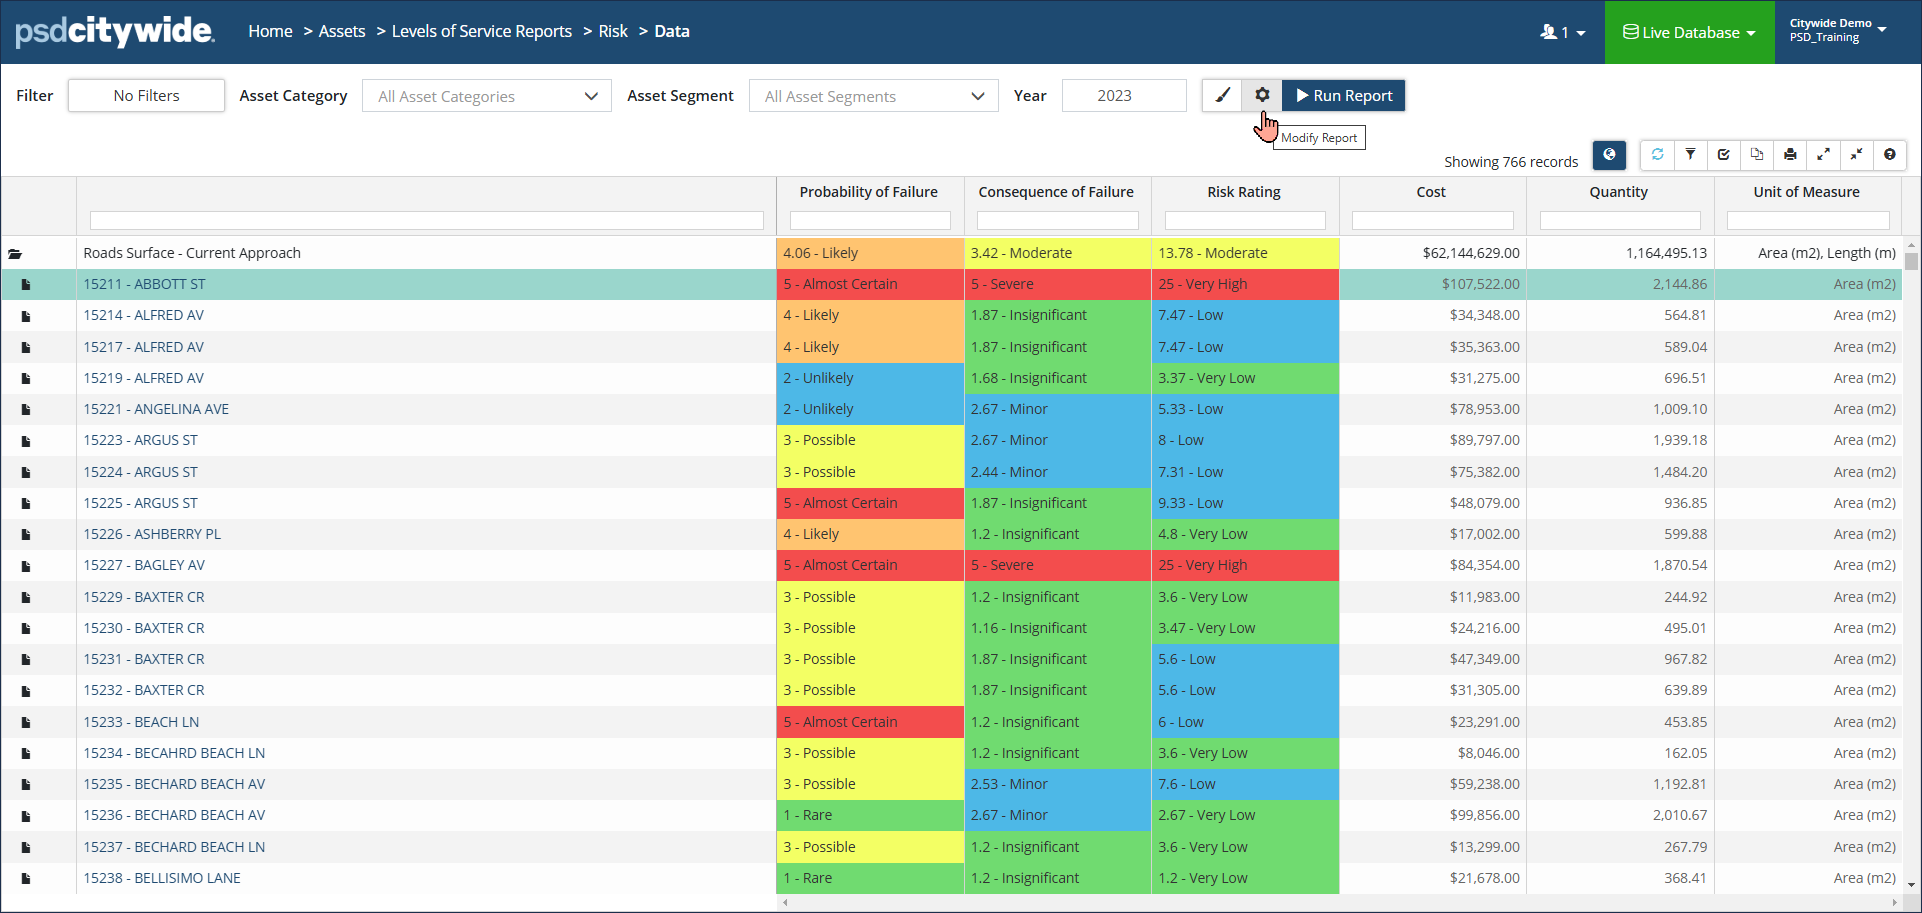
Data View: Shows Risk information for the reporting year. Includes Averages and Totals at the bottom. Selection criteria settings include: ● Group By ● Primary Classification ● Secondary Classification ● Include Lifecycle Events ● Show Incomplete Assets Click Modify Report settings to adjust Event Start Year or change the Strategy Method Click the globe icon to view mapped assets in the GIS viewer. |
 |
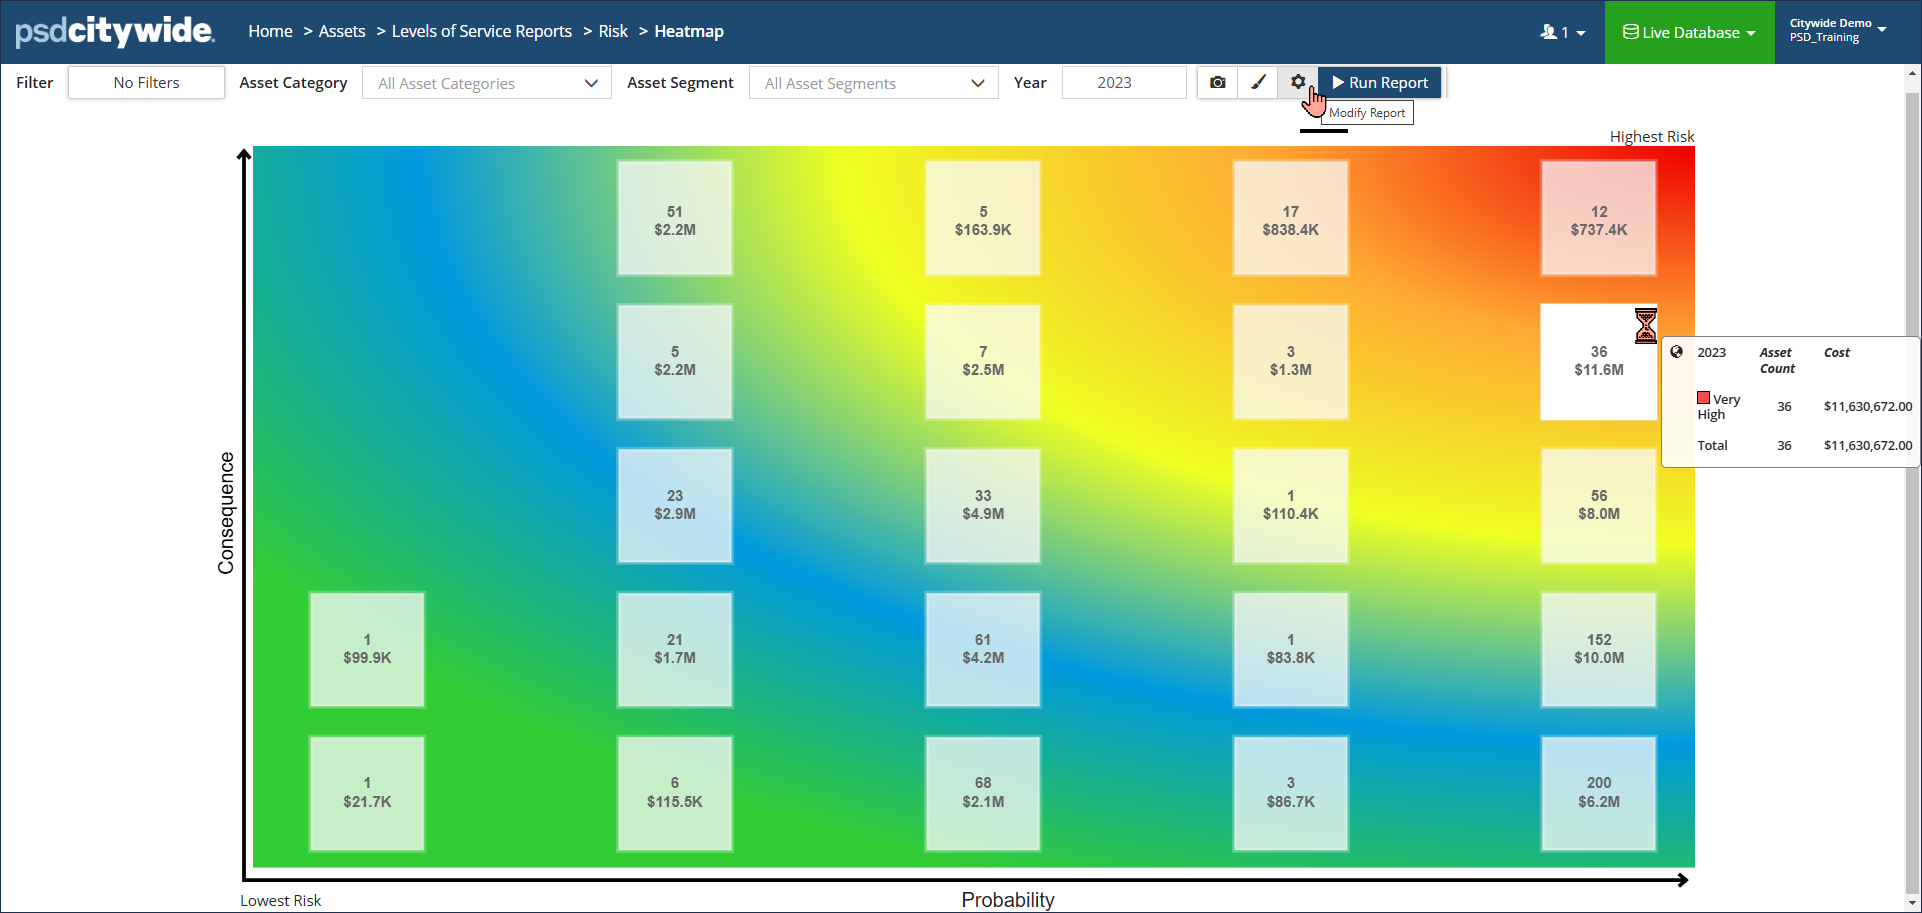
| Heatmap: Summarizes the total number of assets that fall within each risk level. Hover your mouse over any risk rating box to show additional totals of Asset Count and Cost.
Click a box, to view the assets in the Inventory list. For example, to view the assets that have a Very High risk, click a highest risk box. Click the map/globe icon on each box to view assets in GIS. Click Modify Report settings to change View or Costing options. Note: the colour-coding may not accurately represent the asset’s actual risk rating, especially in cases with complex risk profiles and decimal rounding. For the most accurate depiction of risk in a report, use Data View (above) or the Risk Rating 1x5 grid (described below) |
 |
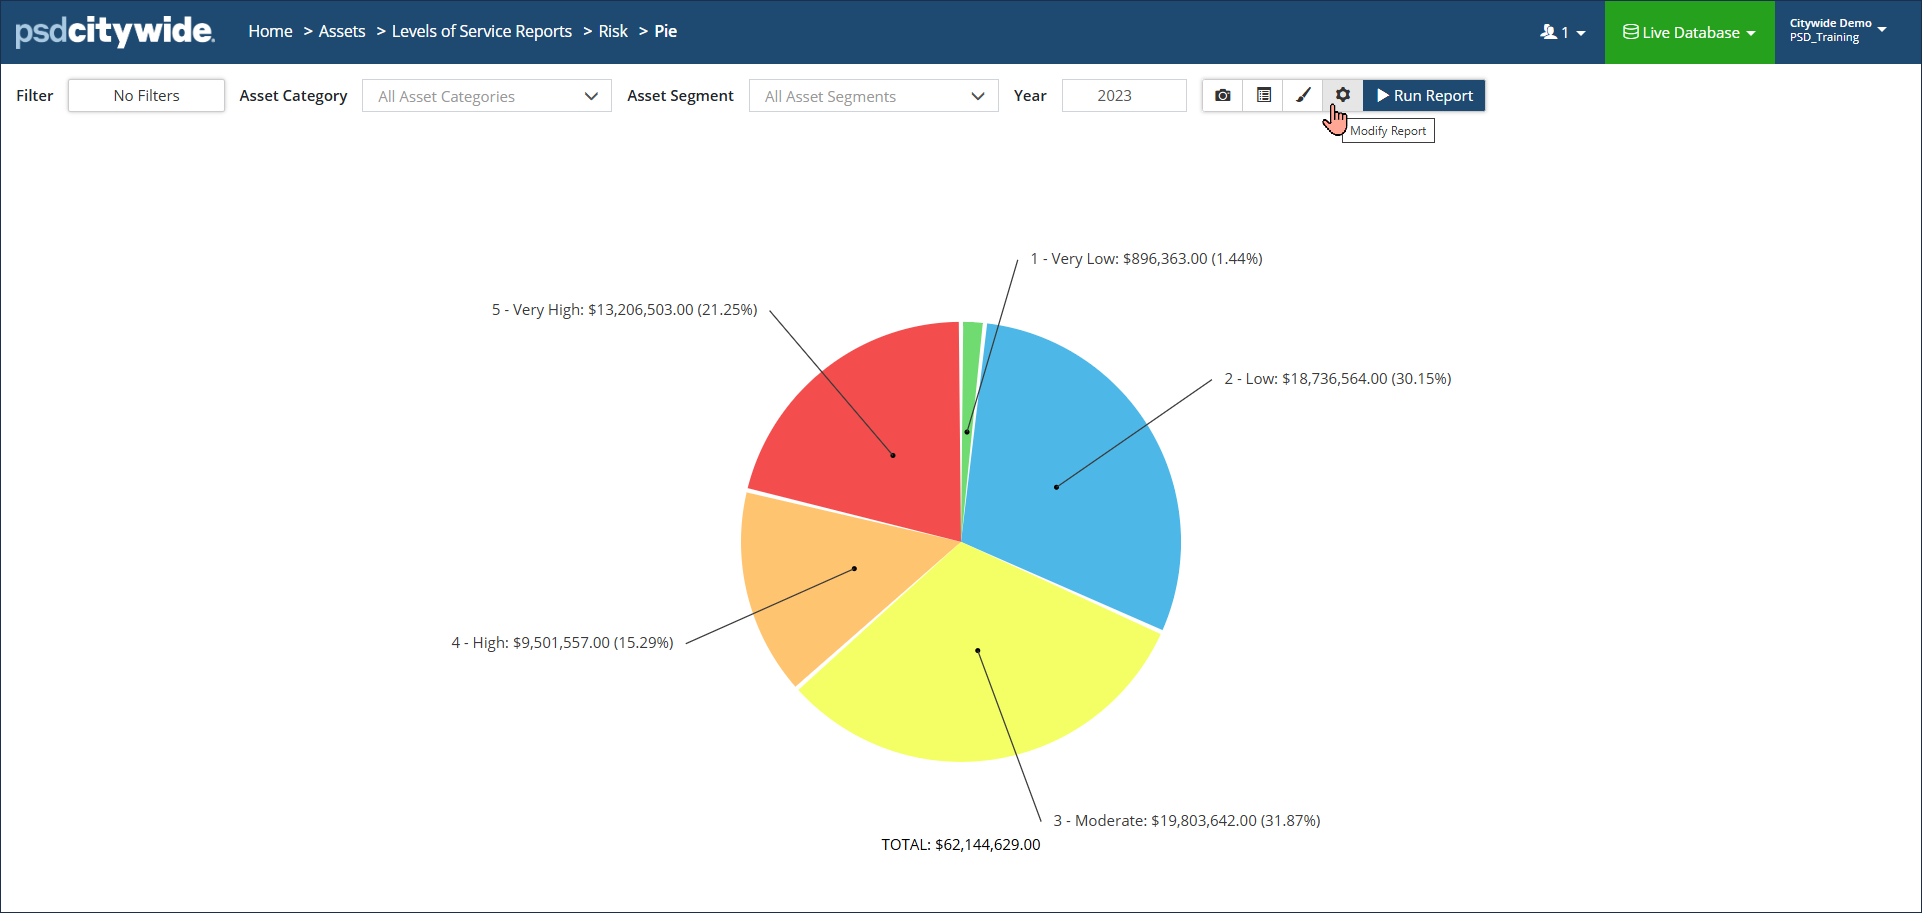
| Pie/Bar Chart: Shows a total Cost or total Quantity for each Risk tier.
Click Modify Report settings to display a total or for additional formatting options. Click Display Options to change Costing or View options. |
 |
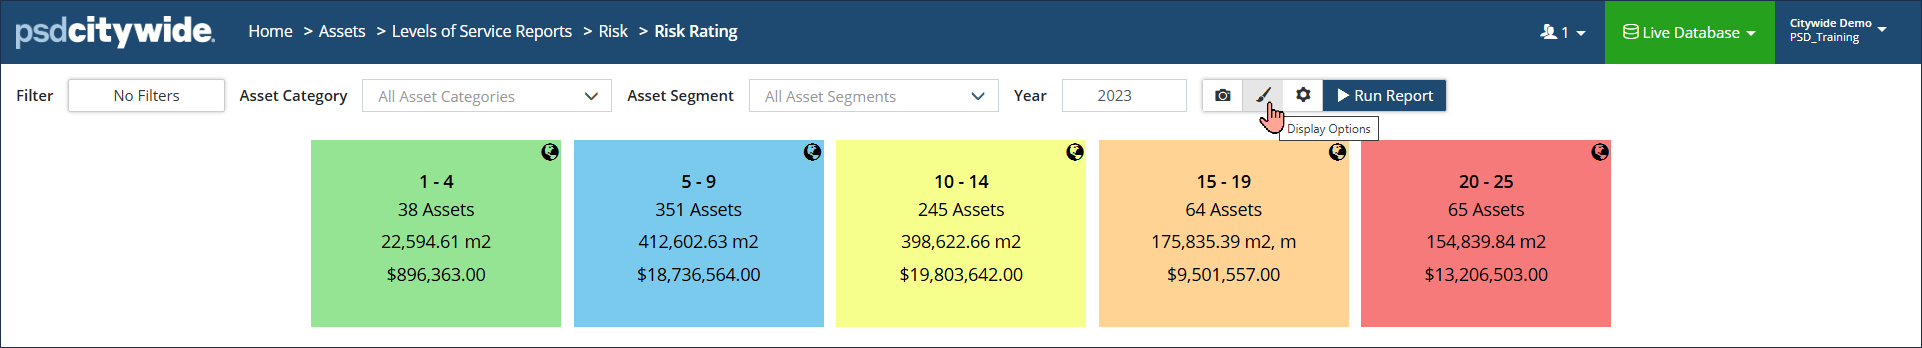
| Risk Rating: Summary of the total number of assets that fall within each tier of the risk range. Additional totals include Adjusted Quantity and Cost. Click a block, to view the assets in the Inventory list or click to view in GIS.
Click Display options to change Costing and View options. |
 |