Averages Report

Feb 25, 2025
The Averages Report provides averages for several Lifecycle fields such as assessed condition, service life remaining, in-service year, asset age, etc. The report will also provide a breakdown of replacement cost per person or per household.
|
Report Type |
|
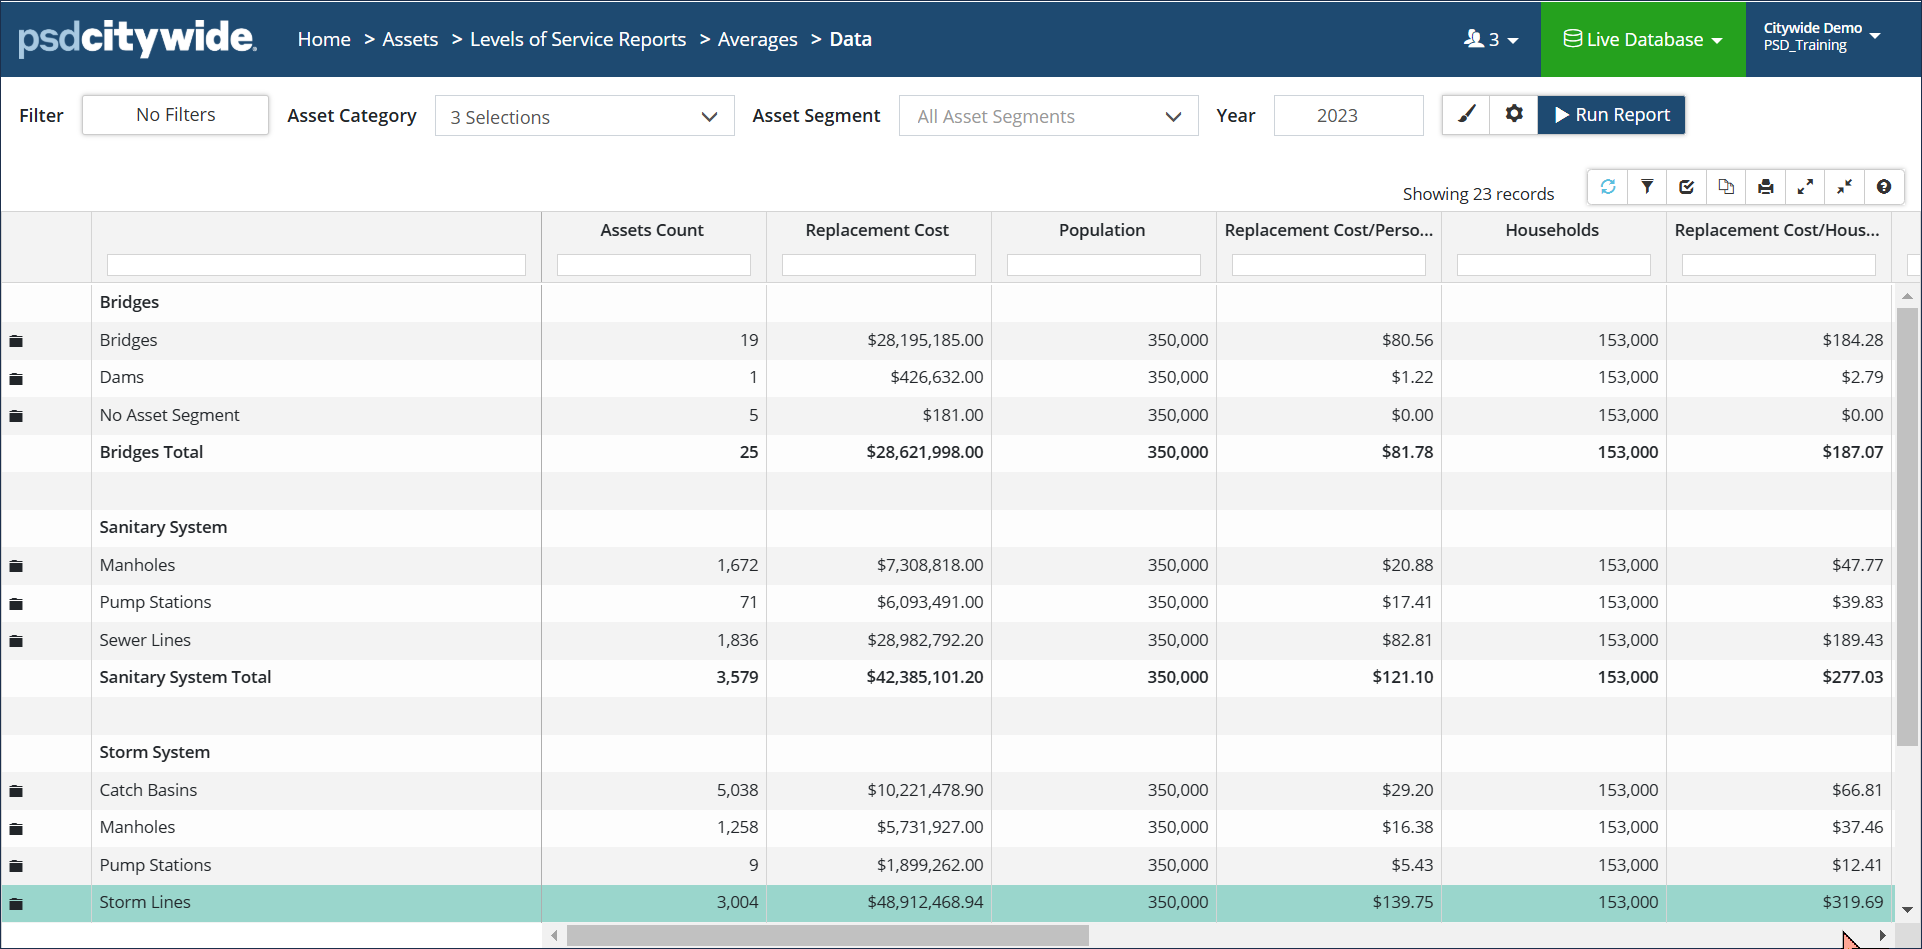
| Data View: Classic report view showing the average condition, in-service year, age, and service life remaining for a group of assets.
Population and Household data is stored in the Client Profile of the Administration section and is used to provide a cost/person or per household. |
 |
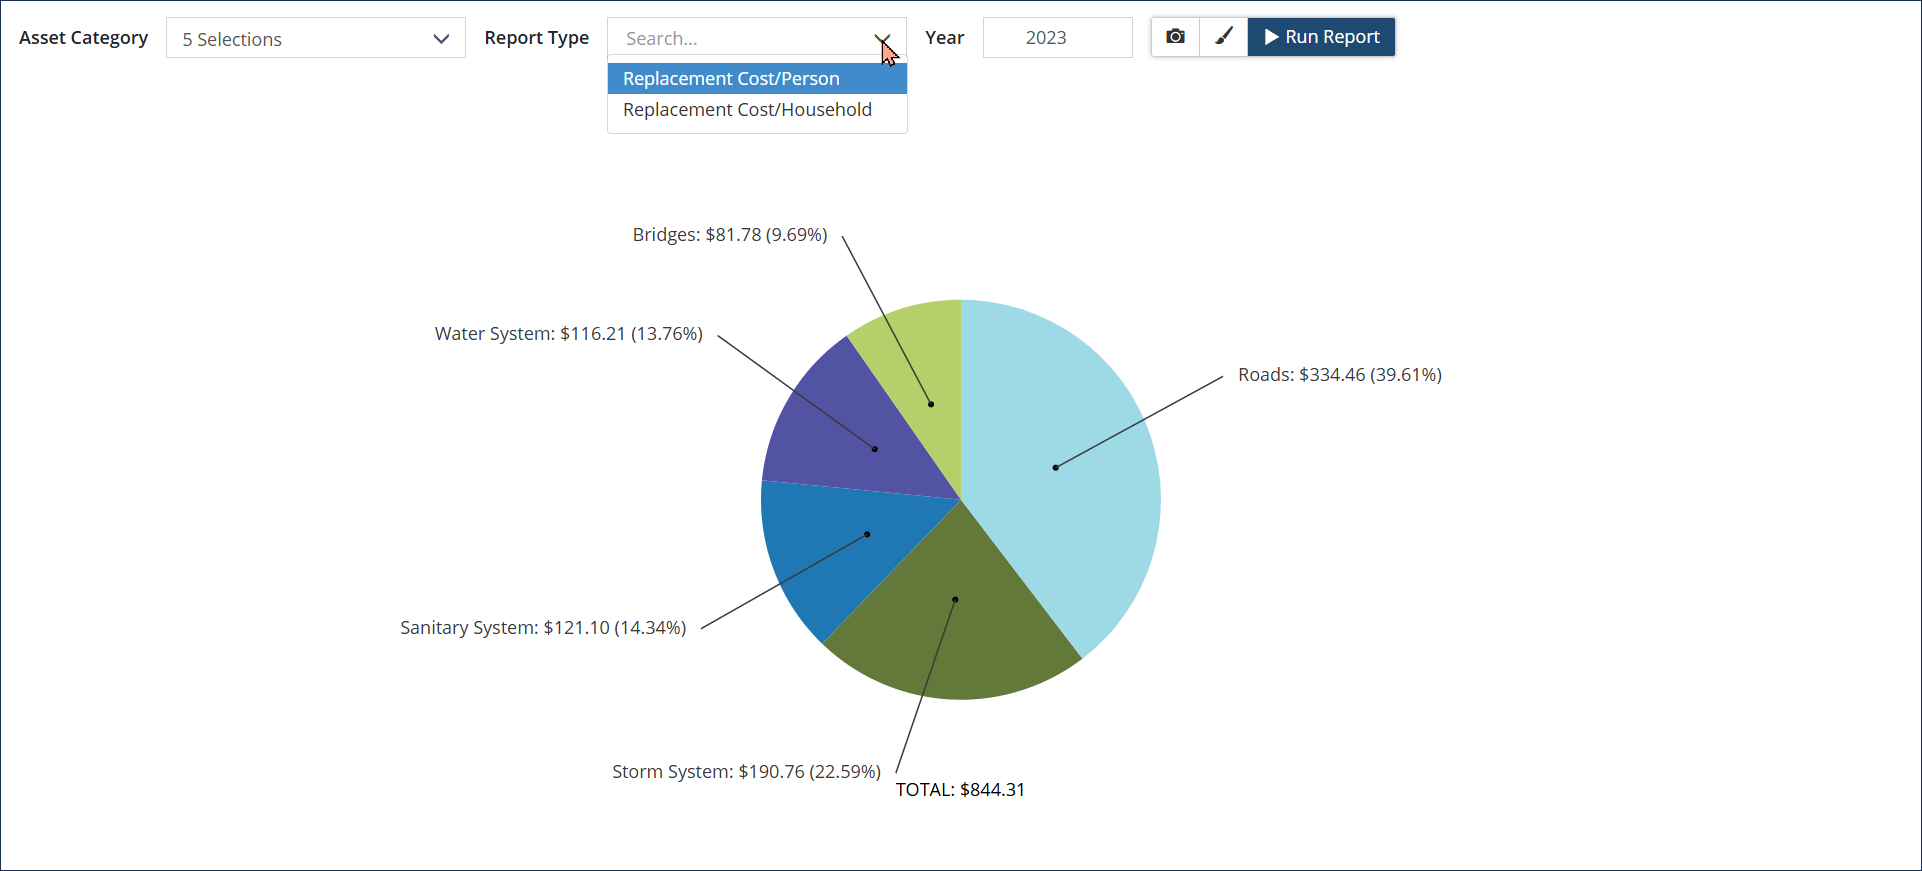
| Pie Chart: Visualization showing Replacement Cost/Person or Replacement Cost/Household.
Click Modify Report settings to add a Total or change font size and decimal places. Click the camera icon to export and save the chart as a .png or .jpg file. |
 |