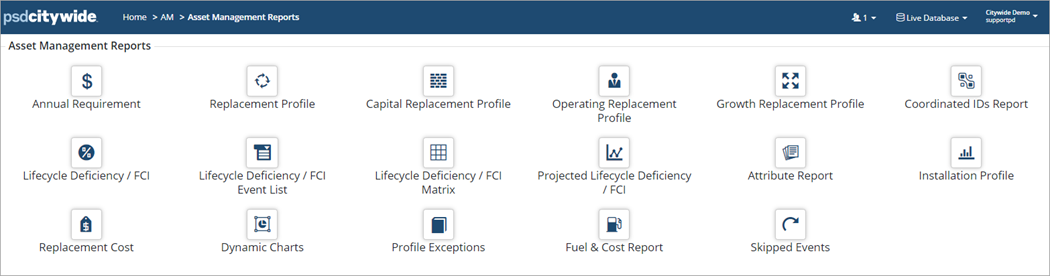
Asset Management reports are used to report on different components of an Asset Management Plan such as a financial strategy or lifecycle strategies that include condition and risk. Only assets with a Replacement Cost are included in these reports.
|
Report Type |
Description |
|
Calculates the average yearly investment amount needed to maintain infrastructure based on the current lifecycle strategies. |
|
|
Shows event cost projections year-after-year. Useful when considering short, medium, and long-term Capital cost projections. Also identifies assets that are backlogged (i.e., assets that are still in use but are at the end of their stated useful life). |
|
|
Capital/Operating/Growth Replacement Profile |
Same as Replacement Profile but filtered for Capital, Operating, or Growth funding source events only. |
|
Coordinated IDs Report |
Same as Replacement Profile but for assets grouped together with a Co-ordinated ID. |
|
Shows Event Costs weighed against Replacement Cost in a classic data view. |
|
|
Lifecycle Deficiency/FCI Event List |
Shows Event Costs weighed against Replacement Cost and includes a deficiency rating where the total event costs are divided by the replacement cost. |
|
Lifecycle Deficiency/FCI Matrix |
Summarizes the deficiency rating of assets using a 5-tiered colour coded range. Asset Count, Quantity and Cost are also summarized. |
|
Projected Lifecycle Deficiency/FCI |
A line graph report showing how the deficiency rating changes over a range of years. |
|
This report allows for analysis of data based on Attributes (i.e., material type, pipe diameter, etc.). |
|
|
Displays the In-Service Date of assets for the reporting year. |
|
|
Summarizes the Replacement Cost or Total Replacement Cost (replacement cost plus events) of assets for the reporting year. |
|
|
Displays the mismatched or incorrect data on assets within a Profile. |
|
|
Summarizes all assets that have skipped events for the reporting year. |