Each database contains several preset views to address many basic needs.
These can be modified during training with your PSD Advisor or after training as required.
See Model Administration: Views and Worksheets for additional information about the CWBC Views.
Modify an Existing View
Go to Model Administration > Classes > Operating > Views 
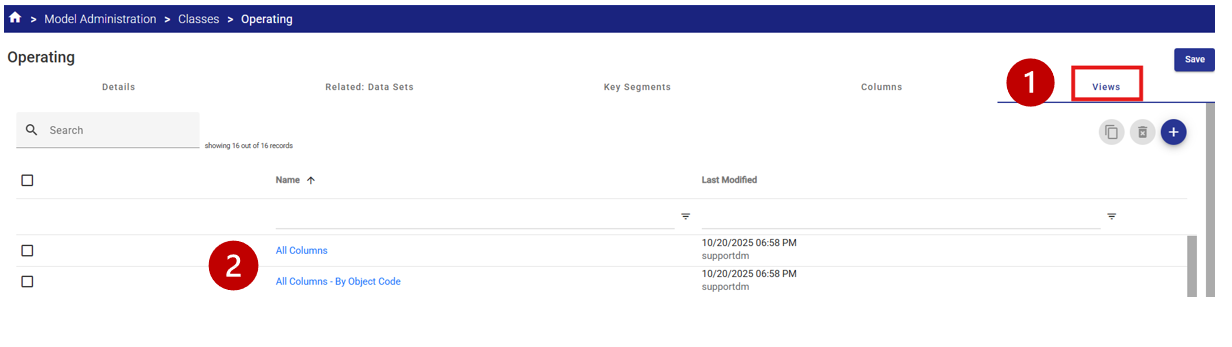
elect the View Name hyperlink  of the View to be updated.
This will open the View’s configuration settings.
Update View Properties
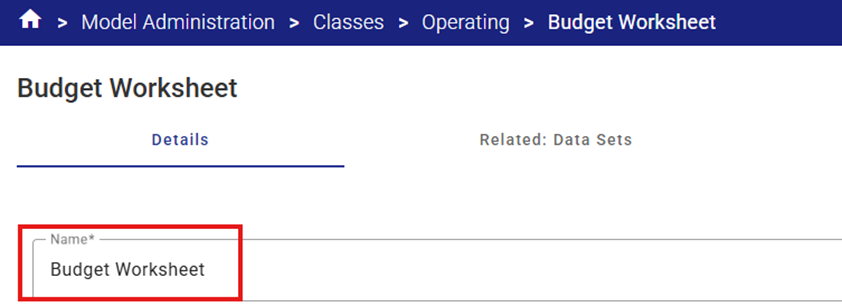
Details tab
The most common changes to be made on the Details page include:
- Name
- Editing Controls (line-item or balance)
- Selections
Name - To update the View Name select the Name field and modify the name as required.
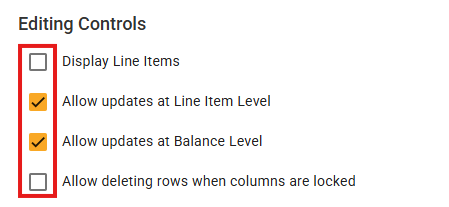
Editing Controls - These can be modified by selecting or clearing the checkboxes as required.
Selections - These can be modified by selecting the radio button corresponding to the desired selection type.
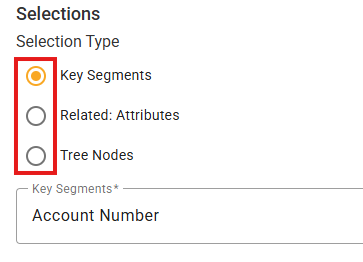
Only one selection type is permitted for each saved View.
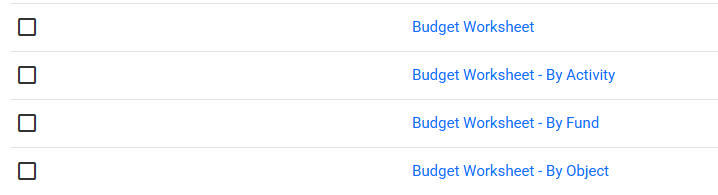
Administrators may want to use the same view design with different selection types (e.g. the basic Budget Worksheet has a default selection type by cost centre segment. This view could be duplicated and a additional Views created (each with a unique View name) to allow for data selection by other segments such as fund, object code or activity).
Related: Datasets tab
The Related Datasets area defines the Datasets that can use the selected View.
Not all views are appropriate for all Data Sets (i.e. The Forecast view would typically only be used with a Forecast Data Set while the Budget Analysis view would be used with the Variance Data Set etc.)
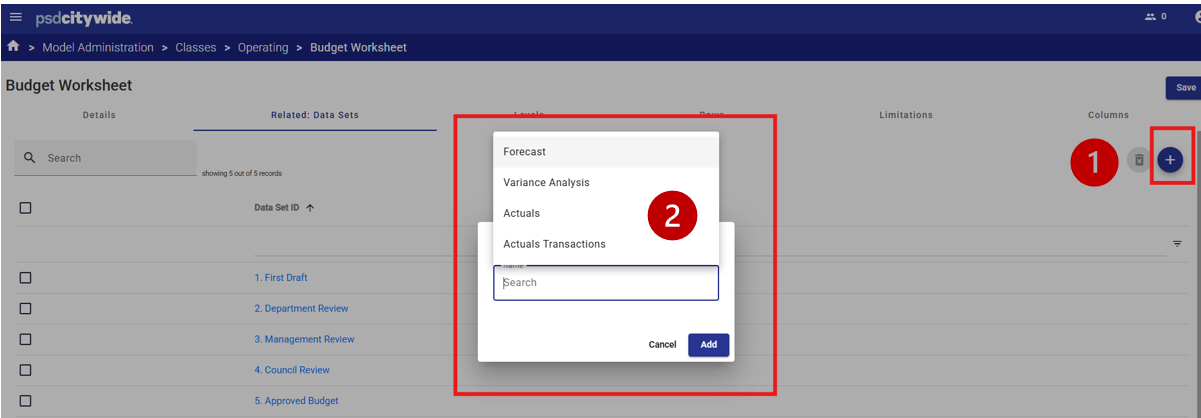
Adding a Related Dataset
A new Related: Data Set can be added by selecting the Add icon 
A dialog box will appear. Select the Data Set to be added from the list  .
.
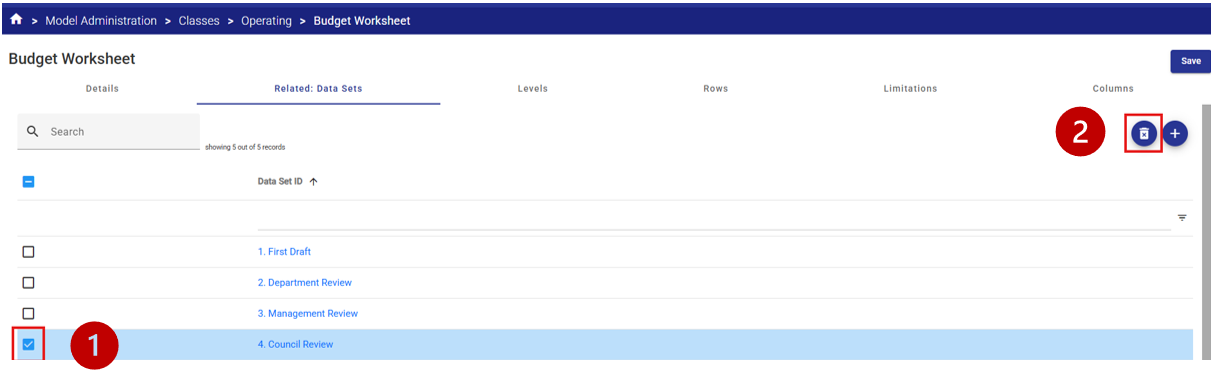
Deleting a Related Dataset
If the System Administrator no longer wants a View to be used with a certain Dataset, the relationship can be deleted.
Deleting the related Dataset will prevent the View from appearing in the View lists for users, but the View remains available to be used with other Datasets in the future if required.
To delete a related Dataset, Select the Data Set relationship to be deleted by ticking the checkbox  .
.
Select the Delete icon  to remove the relationship.
Click Save.
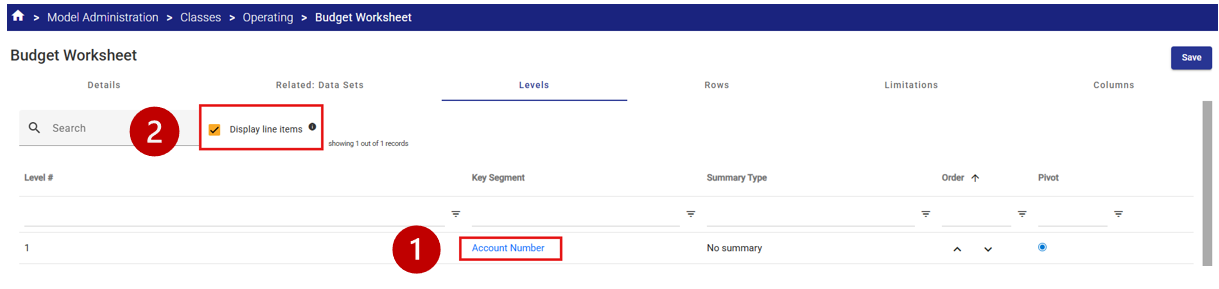
Modify View Levels
Levels define the data that will be brought into the View.
In CWBC there is one Key Segment for each Class (Account Number or Capital Account Number) so there will only ever be one level.
Select the Key Segment  appropriate to the View.
If line-item details are required, leave the Display line items check box ticked  .
.
Modify Row Details
In CWBC, detailed rows can be configured to present data in the format that is best for the user to complete their work.
The available Row types are:
- Custom Rows– a custom row can be a title, a blank row or a calculation.
- Data Rows – a data row pulls in data into the view from the related Class | Data Set | Year as defined in the various View selections.
Simply select the appropriate radio button to activate the Row Type.
Custom Rows
In the Details area of a custom row, the user can define the name of the Row (as it will appear in the View).
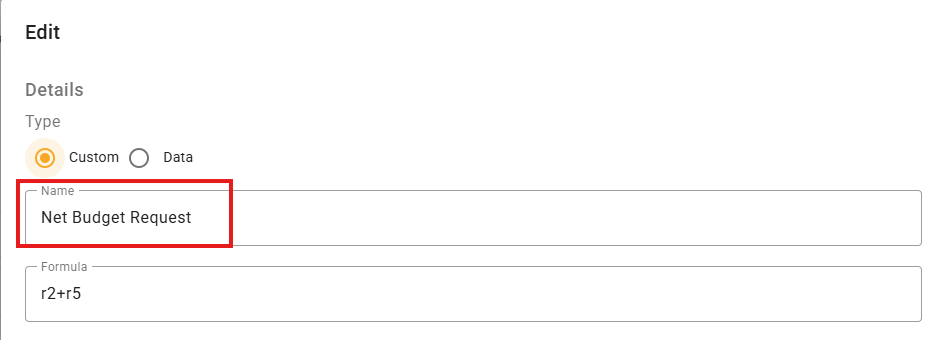
A Formula can also be entered to perform a mathematical calculation relative to the other Rows configured in the View.
Most typical Excel functions can be used, including brackets.
Formulas contain row tokens e.g. r1, r2, rx to identify view columns in the formula.
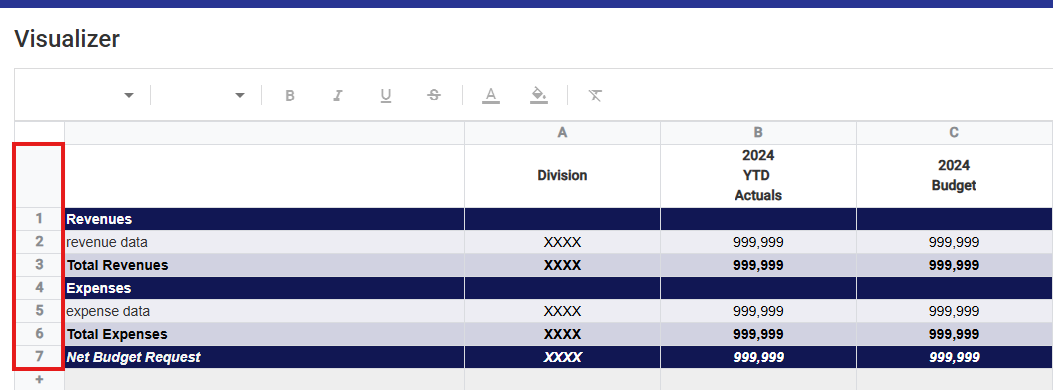
The row numbers are displayed in the row labels next to each row in the Visualizer tool.
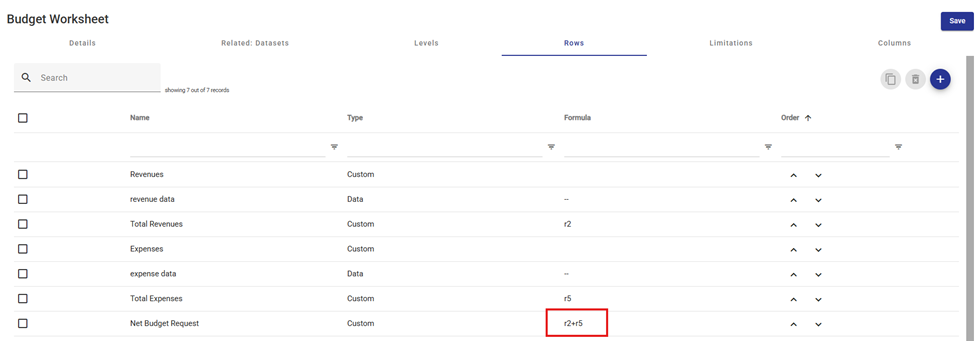
For example, to calculate a net budget request (Revenues (on row 2) + Expenses (on row 5)), the user would enter +r2+r5 in the Formula bar (not case sensitive).
The following basic operators are available:
- +
- -
- /
- *
- As many pairs of nested brackets (..) can be used as required.
Additional examples:
- sum(r2:r9) increments row 2 through 9 and returns the result.
- abs(r11) returns the absolute value of row 11.
- round(r1,2) rounds value of r1 to 2 decimals places.
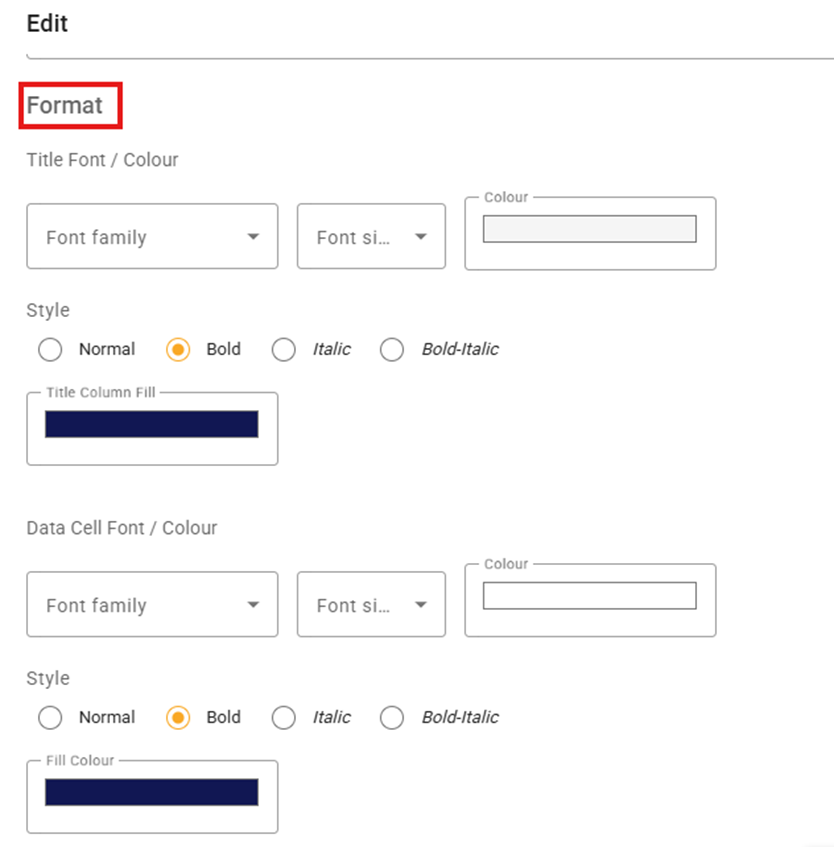
Row Formatting
Formatting options are available for each defined Row, including the font, text colour and background colour.
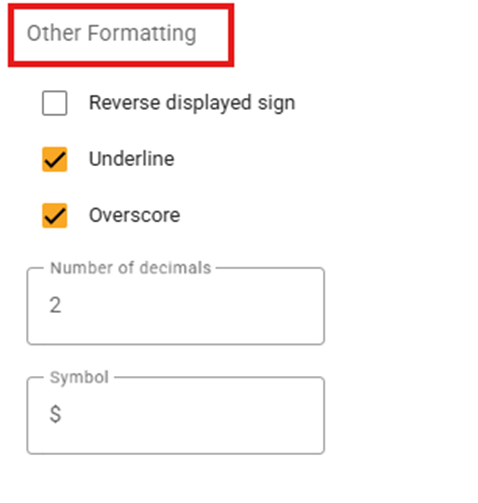
Other Formatting
Other formatting options for a Row include:
- Reversing a displayed sign (for example if the user wants revenues to be displayed without brackets or negative signs despite naturally being credits.
- Adding an underline or overscore (typically for totals and sub-totals)
- Underline places a horizontal line directly beneath a selected cell (similar to adding a bottom border to a cell in Excel)
- Overscore places a horizontal line above a selected cell (similar to adding a top border or subtotal line to a cell in Excel).
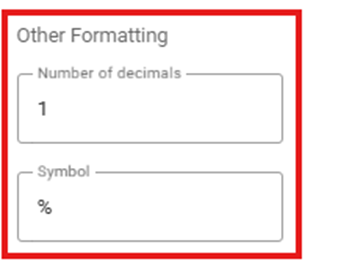
- Select the number of decimals to display in the cell(s) (from 0 to 5)
- Select a symbol to display with numeric data in the cell(s) (typically a $ or %)
Sample Row Design Settings
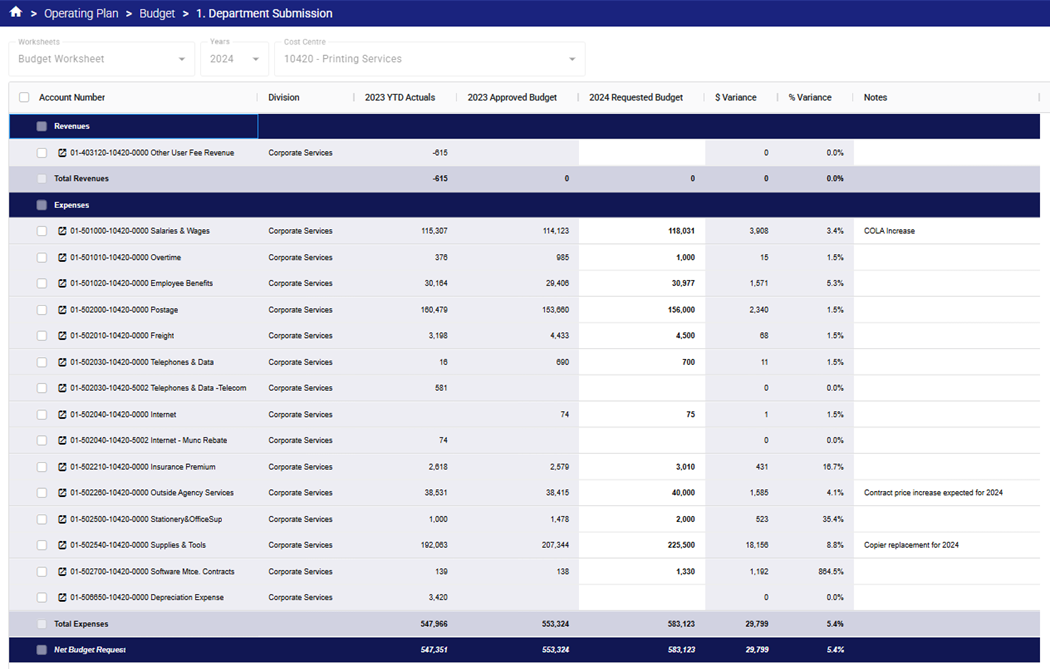
Below is the Row design from the Budget Worksheet.
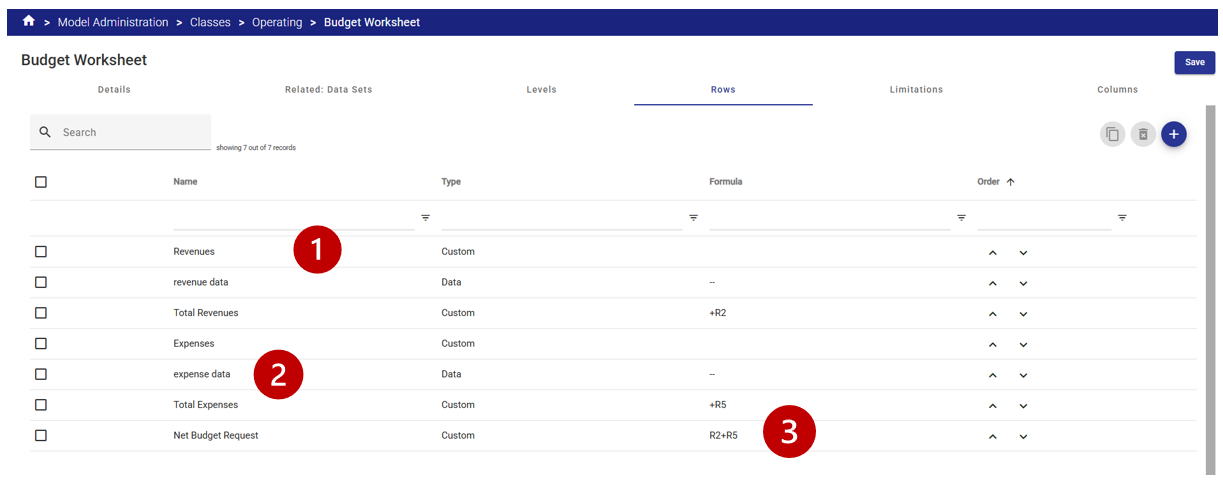
![]() The first row is a Custom Row (title) – in this example called Revenues. The title row is being used to visibly separate the revenue data from the expense data.
The first row is a Custom Row (title) – in this example called Revenues. The title row is being used to visibly separate the revenue data from the expense data.
 The “expense data” row is an example of a Data Row (as is the “revenue data” row above it). By default a data row will pull in all data related to the Class | Data Set | Year | View Selection. In this case the view designer only wants to include expense data in the Data Row so Limitations will be applied to the Row (see Limitations section below).
![]() The “Net Budget Request” row is another example of a Custom Row – in this case a formula. The formula for the calculation is visible from the main view and can be edited by editing the Row.
The “Net Budget Request” row is another example of a Custom Row – in this case a formula. The formula for the calculation is visible from the main view and can be edited by editing the Row.
Update View Limitations
Limitations can be used to limit the data included in the Levels, Rows or Selection (for the Key Segments selection option).
Levels - Used to limit the Key Segment data included in the view (i.e. the GL account numbers). Limits can be applied using ranges, wildcards or Natural Account Types.
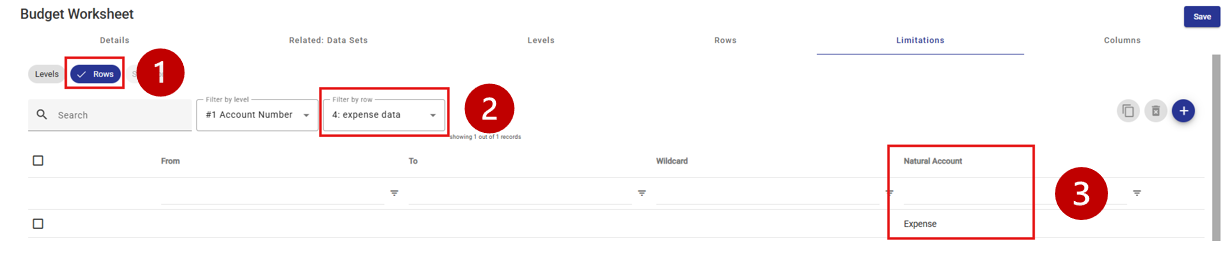
Rows ![]() - Used to limit the data in a specific row defined in the View. In the Budget Worksheet example, the “expense data” Row
- Used to limit the data in a specific row defined in the View. In the Budget Worksheet example, the “expense data” Row ![]() has a limitation applied to restrict the content to Key Segments with the Natural Account Type of "Expense"
has a limitation applied to restrict the content to Key Segments with the Natural Account Type of "Expense" ![]() .
.
Update Selection Settings
Used to filter the items that appear in the Selection list when the view is used. Related Segments or Tree Relationships can both be used as selection filters.
Update Column Settings
The columns define the Class Columns included in the View.
The Column Types available are:
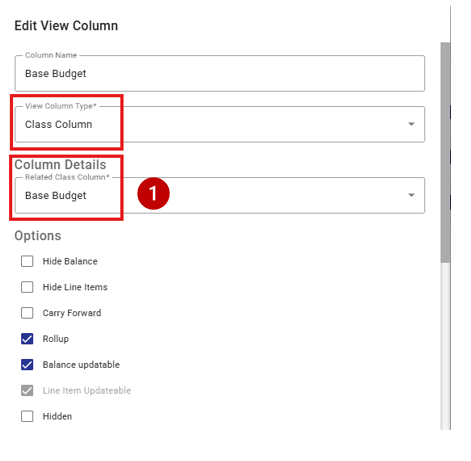
- Class Column - A column which references a base class column and is usually updateable by the user when the view is opened. The type of data that can be entered into the resulting view column depends on the type of the class column selected, i.e. numeric, text, date etc.
- Comparative - A comparative column references data from another version / year (other than the primary version / year selected in the view). These columns are for information purposes and are always non-editable. The data is always from the same class as the primary view class. Comparative data definition options include:
- Source Columns for the comparative data
- Full Year data
- Year to Date data
- Data from a Specific period or column (selected by the view designer or at run time by the user). The period can be the period alone or the YTD information up to that period end (i.e. March YTD would include January, February and March data).
- Data compiled using a Period or Column rollup (such as the Budget Rollup to include all budget columns or the Calendar Rollup to include all monthly Jan-Dec columns)
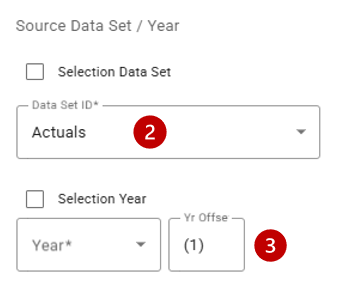
- Source Dataset / Year for the comparative data
- The Dataset specified by the View designer (selected from drop down list)
- The View Year can be the default selected when the View is open, or a year specified by the View designer (selected from drop down list).
The Year can also be set to be an offset to the default selection (i.e. if the Selection Year was 2025 and the Yr Offset was -1, the data displayed in the column would be 2024 data).
- Source Columns for the comparative data
- Calculated - A column which contains a formula, which references other columns in order to produce a result. Calculated columns are non-updateable. See formula information above in Rows.
- Segment (Attribute) Relationship - A Segment or Attribute Item which is related to one of the Class Key Segment items may be displayed in a column. For example, we might have an Attribute called Project Manager, which is related to the Capital Project. Against each key (row) of the view, the relationship column will display the Project Manager related to the Capital Project contained in the key.
- Tree Relationship - A Node of a Tree may be displayed in a column, based on a rollup relationship to one of the Key Segments included in the View data.
For example, if there is an Organization tree which rolls up COA Class Key Segment Items into Departments, Divisions etc. the designer might choose to display the Division in a Tree relationship column. The Division displayed in the row within the column will depend on its relationships to the Key Segment for that row.
The View designer can select additional display options for a Class Column including:
- Hide Balance – the balance will not be displayed when the View is opened
- Hide Line Items – the line items will not be displayed when the View is opened
- Carry Forward – If selected, a number entered in an updateable line-item cell will increase the associated cell on the balance line. In some cases, for example a rate, the balance cell does not represent an increment of the underlying line items, so this option would not be selected. However, in most cases it is required that an increase or decrease in a cell at the line-item level will also increase or decrease the associated balance cell. In the case of calculated columns (formulas) this flag means that the balance cell will always be the sum of the underlying line-item cells regardless of the column formula.
- Rollup – This option determines whether an automatic sub-total is generated for column cells, and whether, when the view is in a collapsed state, the underlying cells are incremented and the total displayed. In some cases, for example a cell representing a rate, it does not make sense to sub-total or rollup.
- Balance Updateable - Determines whether cells at the balance level for this column can be updated. This works in conjunction with a similar control on the associated class column and the Allow Updates at Balance Level view control which applies to all columns in the view. If a class column should never be updated on-line, the class column control should be used. If the class column may be updated through some views but not through this specific view, this control should be used.
- Line-item Updateable - Same as balance updatable, except it applies to the line-item level.
- Hidden – The column will be hidden in the view (may be used where a column is used for calculations that do not need to be displayed to the end user).
Sample Column Design Settings
In the Budget Worksheet example below, a variety of column types are included in the view to provide information to the user that assists in entering their budget and to budget reviewers.
The Visualizer tool is the easiest way for a View designer to create or modify a view.
All functions can also be performed from the Columns tab of the selected View.
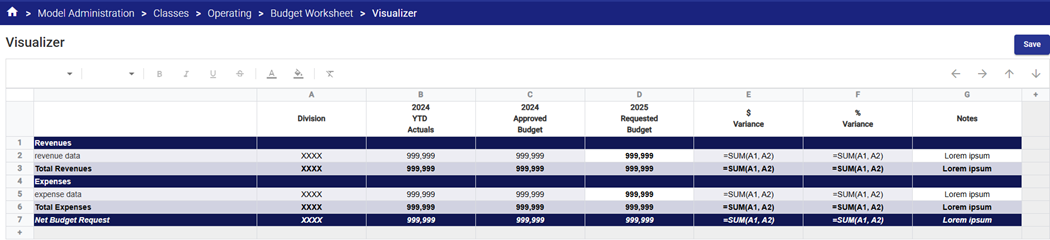
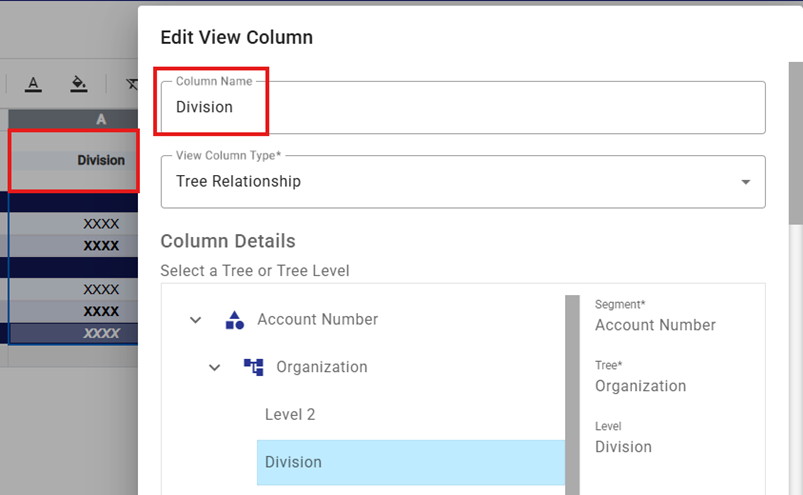
Column A – Division
The Column Type is Tree Relationship. The Tree or Tree Level selected from the Tree diagram that is related to the Key Segment will be displayed in the view.
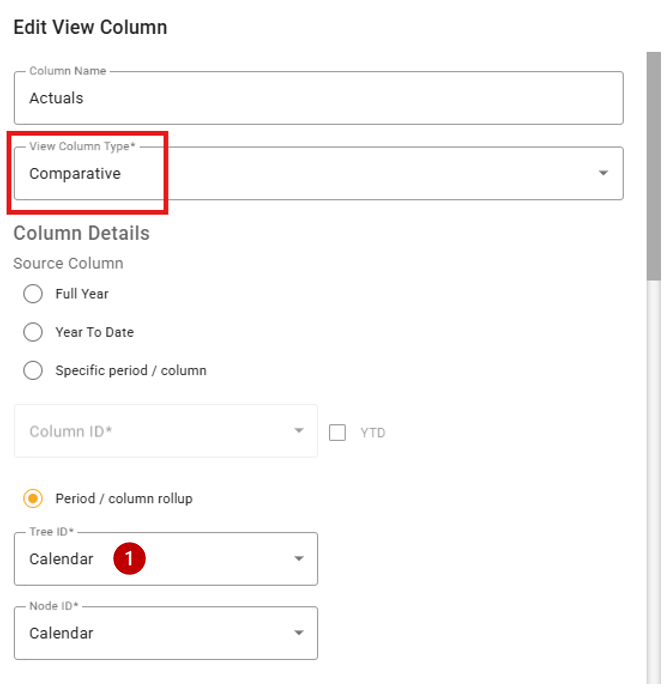
Column B – 2024 Actuals and Column C 2024 Approved Budget
The Column Type in both cases is Comparative. The column will display data from a Data Set | Year that is not the Data Set | Year the user selected when the view was opened.
In the Budget Worksheet example, data displayed in the Column labelled Actuals is a summary of Class Columns using the Calendar Rollup  , in the Actuals Data Set
  for the year prior to the selection year
  .
.

Column D and G
The Column Type is Class Column. The column will allow the users to enter or update data that will be saved into the Class Column | Data Set | Year that the user selected when the view was opened.
In the Budget Worksheet example, data displayed in the Column labelled 2025 Requested Budget is numerical budget data that will be entered by the user (note that the cell appears white in the example vs. grey for the read-only/comparative cells).
This data will be saved in the “Base Budget” Class Column  for the Data Set and Year selected when the user opened the view.
The data in column G labelled Notes is a space for the user to enter text data that will be saved in the Department Comments Class Column for the Data Set and Year selected when the user opened the view.
Column E and F
The Column Type is Calculated. The column will display the results of the mathematical calculation defined in the Formula box  .
.
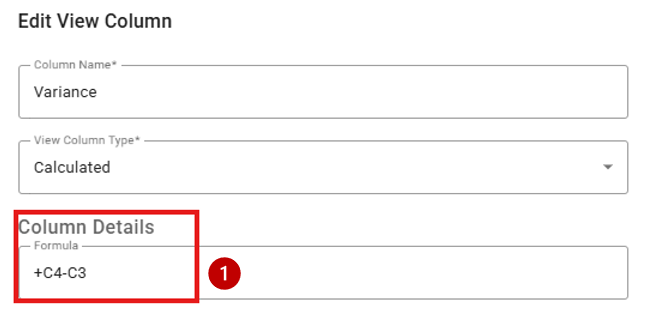
In Column F the calculation results in a percentage so the View designer has specified the number of decimals for display as 1 and for a % symbol to be included.
These formatting selections can be made for each column independent of the others.
Check your results
- Open the view with a dataset and verify that the content, calculations, formatting etc. are correct.
- Remember there are 3 rows available for column labels (i.e. displayed column headers or titles) – text does not wrap so separating the label into 2 or 3 lines can keep the view compact and readable.
- Column widths can be set to a fixed width or the “Fit to data” radio button can be selected to let the column width adjust automatically to the data size.
- Formatting is most easily checked from the Visualizer.
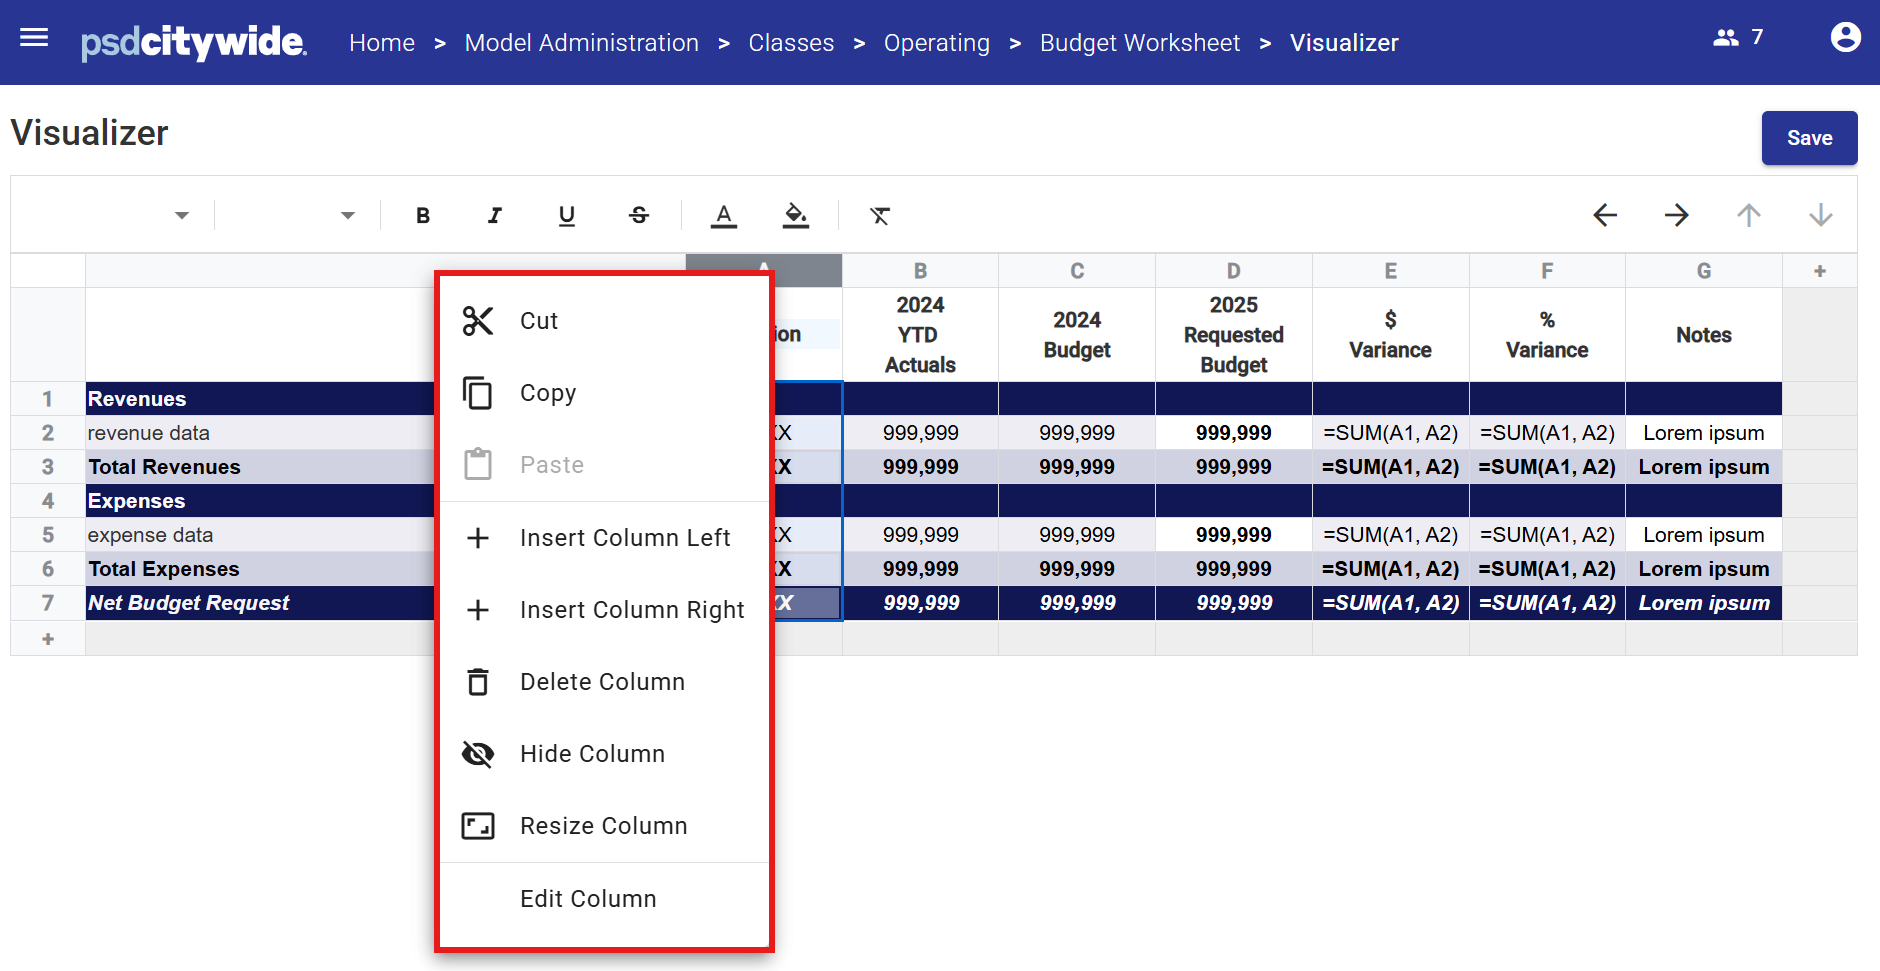
Using the Visualizer Tool
The Visualizer tool can be used to graphically build view columns and rows, while seeing an accurate representation of how the data will appear when the View is used in Operating Plan or Capital Plan.
It is usually preferable to define Rows within the Visualizer because this tool make it easier to see the design and formatting results.
In order to work with a Row or Column using the Visualizer Tool, right-click on the Row or Column header, and a pop-up menu will be displayed, including all the properties available for update.
| Function | Description |
| Cut / Copy / Paste | If a Row or Column is Cut, it is removed from the view and stored in the clipboard. Formulas in calculated Rows or Columns which depend on the one removed are automatically adjusted. If a Row or Column is copied, the definition is stored in the clipboard. If a Row or Column definition is present on the clipboard, the Paste option replaces the currently selected definition with the attributes of the definition held in the clipboard. |
| Insert Row/Column Before / After | This inserts a new Row or Column either before or after the currently selected one. The initial definition used for the inserted Row or Column is derived as follows: If there is a definition on the clipboard from a cut or copy operation, the new one will take on this definition. Otherwise, the new element will be a copy of the currently selected one. Once the new Row or Column has been inserted with an initial definition, its attributes can then be changed as required. While formulas for impacted calculations are automatically adjusted if possible, it is important to verify all calculations remain accurate after insertions and deletions. |
| Delete | Deletes the selected Row or Column. For this operation, one or more items may be selected at once. While formulas for impacted calculations are automatically adjusted if possible, it is important to verify all calculations remain accurate after insertions and deletions. |
| Hide | Hides the selected Row or Column. |
| Resize Columns | Opens the Resize Columns dialogue box and allows the user to change the width of the selected Column. |
| Limitations | Opens the Row Limitations dialogue box and allows the user to change Row Limitations (see above) for the selected Row. |
| Edit | Opens a dialogue box where the user can update and define the attributes of the selected Row or Column. |